Friday, August 1, 2025
HomeGamingAn affordable RTX 5070 laptop? Gigabyte Gaming A16 review

An affordable RTX 5070 laptop? Gigabyte Gaming A16 review

The Gaming A16 earned a good overall score of 80%. On the positive side, the consistent CPU and GPU performance are worth pointing out. While the built-in Core i7-13620H is technically no longer completely up-to-date, the Raptor Lake processor is still easily sufficient for modern games.

Aside from the 8 GB issue, the GeForce RTX 5070 also achieved decent results, although sometimes you have to resort to DLSS or frame generation at higher details in its native QHD+ resolution. The case can be described as solid in terms of quality and stability, but isn’t a particular standout. The same applies to the input devices.

There are enough ports, but Gigabyte has omitted the modern Thunderbolt or USB 4, and although the built-in Core i7-13620H is technically no longer completely up-to-date, the Raptor Lake processor is still easily sufficient for modern games. 

In terms of maintenance options, the Gaming A16 impresses with two SO-DIMM and two M.2 slots, one of which is free. The 165 Hz IPS display boasts a usable brightness and doesn’t exhibit any glaring flaws in any other areas (apart from visible screen bleeding at the edges). Battery life and sound are also not bad. Gigabyte could improve the SSD cooling system, since the built-in 1 TB drive’s performance is throttled during extended use. As our gaming mode tests highlight, the device also gets very loud under load, which is similar to most gaming laptops.

Pros

+ constant CPU & GPU performance

+ two SO-DIMM and M.2 slots

+ decent battery life

+ good sound

Cons

pretty loud under load

slight SSD throttling

screen bleeding

no USB 4

The Gigabyte Gaming A16 GA6H with the RTX 5070 is available from Amazon starting at around $1,500. Alternatively, the device is also available to purchase with the RTX 5050 and RTX 5060.

Processor

Intel Core i7-13620H 10 x 1.8 – 4.9 GHz, 82 W PL2 / Short Burst, 50 W PL1 / Sustained, Raptor Lake-H

Memory

16 GB 

, SO-DIMM DDR5-5600, two slots (one empty)

Display

16.00 inch 16:10, 2560 x 1600 pixel 189 PPI, NE160QDM-NYJ (BOE0C80), IPS, glossy: no, 165 Hz

Mainboard

Intel Alder Lake-P PCH

Storage

Kingston OM8PGP41024Q-A0, 1024 GB 

, NVMe SSD, two M.2 slots (one empty)

Soundcard

Intel Alder Point-M/P PCH – HD Audio

Connections

1 USB 2.0, 3 USB 3.0 / 3.1 Gen1, USB-C Power Delivery (PD), 1 HDMI, 1 DisplayPort, Audio Connections: Line-In/Out

Networking

Realtek PCIe GBE Family Controller (10/100/1000MBit/s), Intel Wi-Fi 6E AX211 (a/b/g/h/n = Wi-Fi 4/ac = Wi-Fi 5/ax = Wi-Fi 6/ Wi-Fi 6E 6 GHz), Bluetooth 5.2

Size

height x width x depth (in mm): 23 x 358 x 263 ( = 0.91 x 14.09 x 10.35 in)

Battery

76 Wh Lithium-Polymer

Operating System

Microsoft Windows 11 Home

Camera

Webcam: FHD
Primary Camera: 2 MPix

Additional features

Speakers: 2x 2W, Keyboard: Chiclet, Keyboard Light: yes, 150W Power Supply, GiMATE, 24 Months Warranty

Weight

2.26 kg ( = 79.72 oz / 4.98 pounds), Power Supply: 486 g ( = 17.14 oz / 1.07 pounds)

Note: The manufacturer may use components from different suppliers including display panels, drives or memory sticks with similar specifications.

Gigabyte has opted for plastic for the case, which results in an unsurprisingly mediocre feel. However, its stability isn’t far behind its competitors. In most places, the chassis barely gives way, even under heavy pressure. One of the Gaming A16’s highlights is its generous 180° opening angle, which isn’t something you often see in gaming laptops. The design has a playful touch here and there (especially on the bottom of the case), but overall, the 16-inch model still makes a fairly understated and solid impression.

Weighing around 2.3 kg, the device is also slightly lighter than its competitors, which weigh between 2.4 and 2.7 kg. Thanks to a height of 2.3 cm, the chassis also appears relatively thin.

Ports

Gigabyte has equipped its gaming laptop with a total of four USB ports, only one of which is Type-C. Video output is possible via USB-C (DisplayPort 1.4) and HDMI 2.1. There’s also a Gigabit LAN port and an audio jack, but buyers will have to make do without a card reader.

The wireless module caused no issues during the test. The Intel Wi-Fi 6E AX211 performed quite well in both transmitting and receiving.

050100150200250300350400450500550600650700750800850900950100010501100115012001250130013501400145015001550160016501700175018001850Tooltip

The Full HD webcam delivers decent image sharpness for a laptop, but it lacks a privacy shutter.

The laptop comes with a few information leaflets and a fairly compact 150-watt power supply.

To remove the base plate, you will have to remove 11 Phillips screws. As shown in the photos, the cooling system consists of two fans and several heat pipes. In addition to the RAM and storage, the wireless module can also be replaced if necessary.

Gigabyte has used mostly cardboard for packaging, but the packaging isn’t completely plastic-free.

In Germany, the device comes with a 24-month warranty.

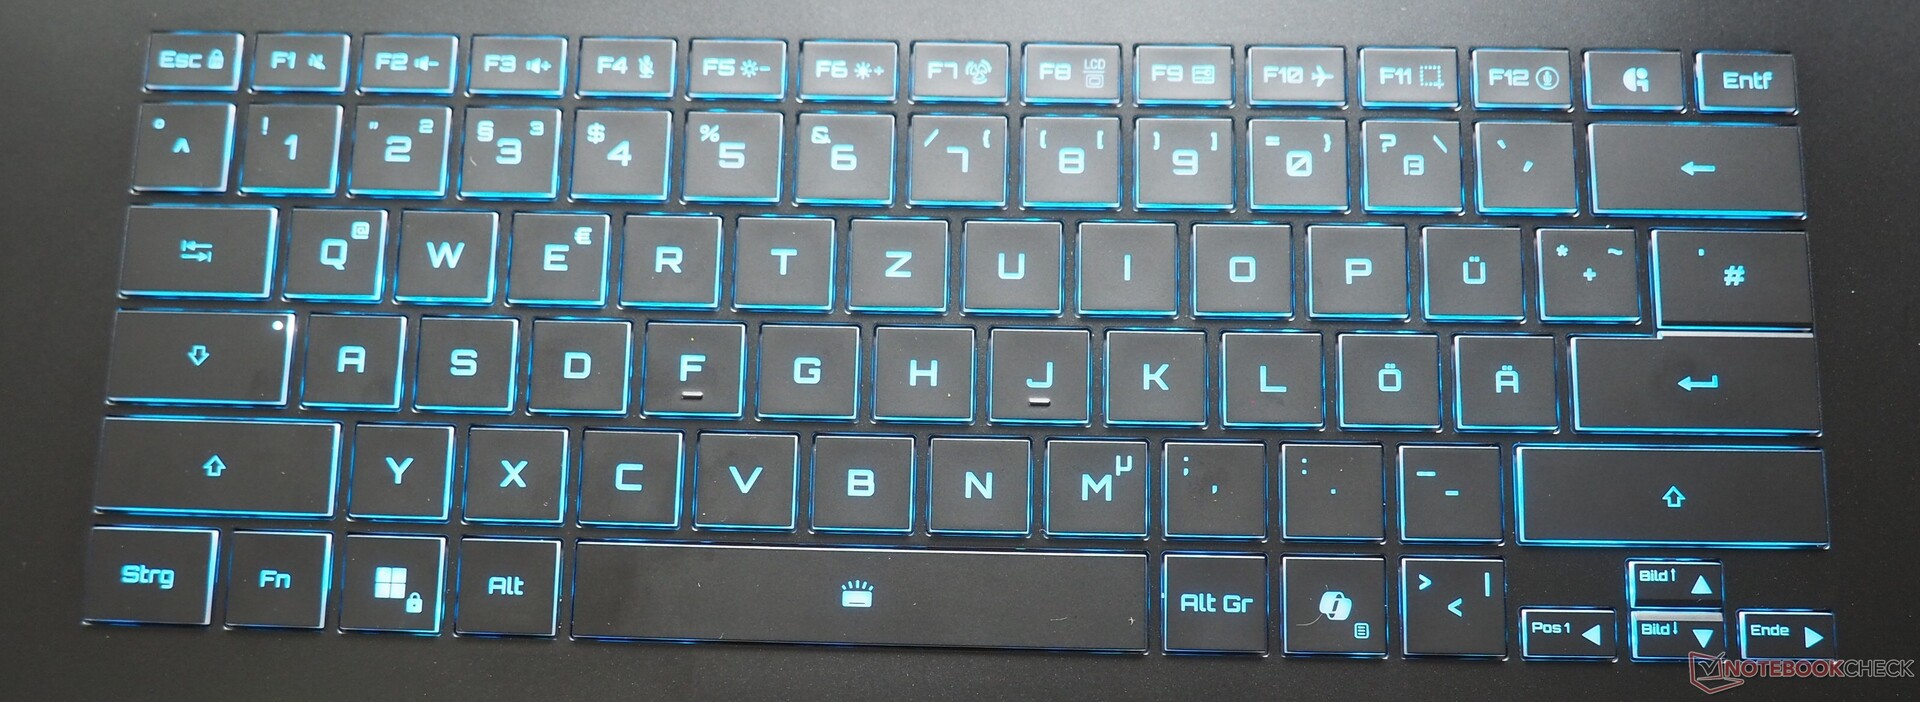
The backlit chiclet keyboard’s layout has turned out to be a bit idiosyncratic. Similar to MSI, Gigabyte has relocated the <>| key and uses a single-line Enter key in the German version. The tiny directional arrows may also be annoying to some users. The typing feel is acceptable for a rubber dome model. Incidentally, the G key in the upper right-hand corner launches the GiMATE wizard, which helps with hardware management.

Gigabyte Gaming A16

The touchpad measures a respectable 13.5 x 9 cm and is quite large for a 16-inch device. The surface is smooth to the touch and offers satisfactory precision. As usual, multi-touch gestures are also supported. The click surfaces respond well.

OLED fans won’t get their money’s worth with the Gaming A16, but, despite this, Gigabyte has gone with a good IPS panel.

422
cd/m²
447
cd/m²
445
cd/m²
413
cd/m²
432
cd/m²
427
cd/m²
405
cd/m²
422
cd/m²
413
cd/m²

Distribution of brightness

NE160QDM-NYJ (BOE0C80) tested with X-Rite i1Pro 3

Maximum: 447 cd/m² (Nits) Average: 425.1 cd/m² Minimum: 10 cd/m²
Brightness Distribution: 91 %
Center on Battery: 432 cd/m²
Contrast: 1168:1 (Black: 0.37 cd/m²)
ΔE ColorChecker Calman: 4.76 | ∀{0.5-29.43 Ø4.83}
calibrated: 1.18
ΔE Greyscale Calman: 6.2 | ∀{0.09-98 Ø5.1}
71.6% AdobeRGB 1998 (Argyll 3D)
99.5% sRGB (Argyll 3D)
69.4% Display P3 (Argyll 3D)
Gamma: 2.079
CCT: 6690 K

Gigabyte Gaming A16 GA6H
NE160QDM-NYJ (BOE0C80), IPS, 2560×1600, 16″, 165 Hz
Gigabyte Aero X16 1WH
MNG007DA5-1, IPS, 2560×1600, 16″, 165 Hz
MSI Katana 17 HX B14WGK
CSOT MNH301CA3-1, IPS, 2560×1440, 17.3″, 240 Hz
MSI Vector 16 HX AI A2XWHG
B160QAN02.3 (AUO7DB2), IPS, 2560×1600, 16″, 240 Hz
Medion Erazer Major 16 X1 MD62736
NE160QDM-NZL (BOE0D55), IPS, 2560×1600, 16″, 300 Hz
Lenovo LOQ 15AHP10
CSOT MNF601BA1-4, IPS, 1920×1080, 15.6″, 144 Hz
Display

-2%

21%

19%

3%

-2%

Display P3 Coverage

69.4

68.7

-1%

97.3

40%

96.6

39%

73.2

5%

67.3

-3%

sRGB Coverage

99.5

96.1

-3%

99.6

0%

99.8

0%

99.8

0%

99.2

0%

AdobeRGB 1998 Coverage

71.6

71.2

-1%

89

24%

84.4

18%

73.9

3%

69.1

-3%

Response Times

18%

17%

42%

28%

-170%

Response Time Grey 50% / Grey 80% *

14.3

Although there is still room for improvement in terms of the color space (no full AdobeRGB or DCI-P3 coverage), the combination of a matte surface and fairly good brightness (an average of 425 cd/m²) ensures good outdoor capabilities in certain conditions.

At over 1,100:1, the contrast ratio is comparable to the competition, and we measured a black level of 0.37 cd/m². The response time is also within the typical IPS range. The same applies to viewing angle stability.

The 165 Hz panel didn’t perform quite as well in terms of color accuracy. Out of the box, the image has a green tint, which can be corrected with calibration (our ICC file is linked above in the illumination chart).

Display Response Times

Display response times show how fast the screen is able to change from one color to the next. Slow response times can lead to afterimages and can cause moving objects to appear blurry (ghosting). Gamers of fast-paced 3D titles should pay special attention to fast response times.

       Response Time Black to White
7 ms … rise ↗ and fall ↘ combined ↗ 2.3 ms rise
↘ 4.7 ms fall
The screen shows very fast response rates in our tests and should be very well suited for fast-paced gaming.
In comparison, all tested devices range from 0.1 (minimum) to 240 (maximum) ms. » 19 % of all devices are better.
This means that the measured response time is better than the average of all tested devices (20.5 ms).
       Response Time 50% Grey to 80% Grey
14.3 ms … rise ↗ and fall ↘ combined ↗ 6.8 ms rise
↘ 7.5 ms fall
The screen shows good response rates in our tests, but may be too slow for competitive gamers.
In comparison, all tested devices range from 0.165 (minimum) to 636 (maximum) ms. » 26 % of all devices are better.
This means that the measured response time is better than the average of all tested devices (32.1 ms).

Screen Flickering / PWM (Pulse-Width Modulation)

To dim the screen, some notebooks will simply cycle the backlight on and off in rapid succession – a method called Pulse Width Modulation (PWM) . This cycling frequency should ideally be undetectable to the human eye. If said frequency is too low, users with sensitive eyes may experience strain or headaches or even notice the flickering altogether.

Screen flickering / PWM not detected

In comparison: 53 % of all tested devices do not use PWM to dim the display. If PWM was detected, an average of 8327 (minimum: 5 – maximum: 343500) Hz was measured.

The Gaming A16 sits firmly in the mid-range when it comes to its components. While 16 GB of RAM and a 1 TB SSD isn’t anything to write home about in 2025, as previously mentioned, the capacity is easily expandable. From a gamer’s perspective, the amount of VRAM is more of a concern – 8 GB doesn’t offer much future-proofing and often reaches its limits.

The preinstalled GiMATE software offers several operating modes. For our tests, we used the Gaming profile, which differs little from Creative Mode in terms of CPU and GPU speed. Automatic graphics switching was always active.

Mode Balanced Game Creative Energy Saving
Cyberpunk 2077 Noise 45 dB(A) 54 dB(A) 54 dB(A) 45 dB(A)
Cyberpunk 2077 Performance (FHD/Ultra) 72.1fps 82.4fps 82.1fps 63.1fps
Cinebench R15 Multi Score 2,302 points 2,351 points 2,334 points 1,796 points
CPU PL1 50 watts 50 watts 50 watts 35 watts
CPU PL2 82 watts 82 watts 82 watts 65 watts

The Intel Core i7-13620H is still being manufactured using the 10nm process and offers six performance cores, including Hyper-Threading, and four efficiency cores without HT. The performance is roughly based on Ryzen 7 250. The newer Core i7-14650HX was hardly any faster, at least in the MSI Katana 17. However, this model doesn’t come close to the current Core Ultra 7 255HX.

0240480720960120014401680192021602400264028803120336036003840408043204560Tooltip
CPU Performance Rating – Percent
Medion Erazer Major 16 X1 MD62736
Intel Core Ultra 7 255HX

86.1 pt

MSI Vector 16 HX AI A2XWHG
Intel Core Ultra 7 255HX

80.8 pt

Average of class Gaming
 

72.6 pt

Gigabyte Aero X16 1WH
AMD Ryzen AI 7 350

61.9 pt

MSI Katana 17 HX B14WGK
Intel Core i7-14650HX

60.7 pt

Lenovo LOQ 15AHP10
AMD Ryzen 7 250

56.9 pt

Average Intel Core i7-13620H
 

55.1 pt

Gigabyte Gaming A16 GA6H
Intel Core i7-13620H

54.4 pt

Cinebench R23
Multi Core
Medion Erazer Major 16 X1 MD62736
Intel Core Ultra 7 255HX

31798 Points +108%

MSI Vector 16 HX AI A2XWHG
Intel Core Ultra 7 255HX

27129 Points +77%

Average of class Gaming
  (5668 – 40970, n=146, last 2 years)

24240 Points +58%

Gigabyte Aero X16 1WH
AMD Ryzen AI 7 350

17865 Points +17%

MSI Katana 17 HX B14WGK
Intel Core i7-14650HX

16453 Points +7%

Lenovo LOQ 15AHP10
AMD Ryzen 7 250

16154 Points +5%

Gigabyte Gaming A16 GA6H
Intel Core i7-13620H

15318 Points

Average Intel Core i7-13620H
  (10819 – 15496, n=6)

14472 Points -6%

Single Core
MSI Vector 16 HX AI A2XWHG
Intel Core Ultra 7 255HX

2167 Points +18%

Medion Erazer Major 16 X1 MD62736
Intel Core Ultra 7 255HX

2111 Points +15%

MSI Katana 17 HX B14WGK
Intel Core i7-14650HX

1975 Points +8%

Gigabyte Aero X16 1WH
AMD Ryzen AI 7 350

1966 Points +7%

Average of class Gaming
  (1136 – 2267, n=146, last 2 years)

1955 Points +7%

Average Intel Core i7-13620H
  (1805 – 1871, n=6)

1842 Points 0%

Gigabyte Gaming A16 GA6H
Intel Core i7-13620H

1833 Points

Lenovo LOQ 15AHP10
AMD Ryzen 7 250

1649 Points -10%

Cinebench R20
CPU (Multi Core)
Medion Erazer Major 16 X1 MD62736
Intel Core Ultra 7 255HX

12316 Points +109%

MSI Vector 16 HX AI A2XWHG
Intel Core Ultra 7 255HX

10626 Points +80%

Average of class Gaming
  (2179 – 16108, n=146, last 2 years)

9347 Points +59%

Gigabyte Aero X16 1WH
AMD Ryzen AI 7 350

6738 Points +14%

Lenovo LOQ 15AHP10
AMD Ryzen 7 250

6320 Points +7%

MSI Katana 17 HX B14WGK
Intel Core i7-14650HX

6236 Points +6%

Gigabyte Gaming A16 GA6H
Intel Core i7-13620H

5896 Points

Average Intel Core i7-13620H
  (4214 – 5905, n=6)

5505 Points -7%

CPU (Single Core)
MSI Vector 16 HX AI A2XWHG
Intel Core Ultra 7 255HX

835 Points +18%

Medion Erazer Major 16 X1 MD62736
Intel Core Ultra 7 255HX

822 Points +17%

Gigabyte Aero X16 1WH
AMD Ryzen AI 7 350

770 Points +9%

MSI Katana 17 HX B14WGK
Intel Core i7-14650HX

762 Points +8%

Average of class Gaming
  (439 – 870, n=146, last 2 years)

753 Points +7%

Gigabyte Gaming A16 GA6H
Intel Core i7-13620H

705 Points

Average Intel Core i7-13620H
  (693 – 719, n=6)

704 Points 0%

Lenovo LOQ 15AHP10
AMD Ryzen 7 250

694 Points -2%

Cinebench R15
CPU Multi 64Bit
Medion Erazer Major 16 X1 MD62736
Intel Core Ultra 7 255HX

4796 (4684.94min – 4796.16max) Points +110%

MSI Vector 16 HX AI A2XWHG
Intel Core Ultra 7 255HX

4114 (4055.56min – 4113.53max) Points +80%

Average of class Gaming
  (1537 – 6271, n=146, last 2 years)

3765 Points +65%

MSI Katana 17 HX B14WGK
Intel Core i7-14650HX

3142 (2262.06min – 2510.83max) Points +38%

Lenovo LOQ 15AHP10
AMD Ryzen 7 250

2544 (2446.48min – 2543.88max) Points +12%

Gigabyte Aero X16 1WH
AMD Ryzen AI 7 350

2432 (2369.95min – 2431.91max) Points +7%

Gigabyte Gaming A16 GA6H
Intel Core i7-13620H

2281 (2213.12min – 2280.89max) Points

Average Intel Core i7-13620H
  (1681 – 2492, n=6)

2246 Points -2%

CPU Single 64Bit
MSI Vector 16 HX AI A2XWHG
Intel Core Ultra 7 255HX

327 Points +26%

Medion Erazer Major 16 X1 MD62736
Intel Core Ultra 7 255HX

322 Points +24%

Average of class Gaming
  (191.9 – 343, n=145, last 2 years)

289 Points +12%

MSI Katana 17 HX B14WGK
Intel Core i7-14650HX

284 Points +10%

Lenovo LOQ 15AHP10
AMD Ryzen 7 250

279 Points +8%

Average Intel Core i7-13620H
  (258 – 269, n=6)

263 Points +2%

Gigabyte Gaming A16 GA6H
Intel Core i7-13620H

259 Points

Gigabyte Aero X16 1WH
AMD Ryzen AI 7 350

204 Points -21%

Blender – v2.79 BMW27 CPU
Average Intel Core i7-13620H
  (215 – 289, n=6)

234 Seconds * -8%

Gigabyte Gaming A16 GA6H
Intel Core i7-13620H

217 Seconds *

MSI Katana 17 HX B14WGK
Intel Core i7-14650HX

206 Seconds * +5%

Lenovo LOQ 15AHP10
AMD Ryzen 7 250

204 Seconds * +6%

Gigabyte Aero X16 1WH
AMD Ryzen AI 7 350

182 Seconds * +16%

Average of class Gaming
  (80 – 517, n=142, last 2 years)

158.2 Seconds * +27%

MSI Vector 16 HX AI A2XWHG
Intel Core Ultra 7 255HX

122 Seconds * +44%

Medion Erazer Major 16 X1 MD62736
Intel Core Ultra 7 255HX

106 Seconds * +51%

7-Zip 18.03
7z b 4
Medion Erazer Major 16 X1 MD62736
Intel Core Ultra 7 255HX

98675 MIPS +72%

Average of class Gaming
  (23795 – 148086, n=144, last 2 years)

89917 MIPS +56%

MSI Vector 16 HX AI A2XWHG
Intel Core Ultra 7 255HX

87806 MIPS +53%

MSI Katana 17 HX B14WGK
Intel Core i7-14650HX

68711 MIPS +19%

Lenovo LOQ 15AHP10
AMD Ryzen 7 250

63475 MIPS +10%

Gigabyte Aero X16 1WH
AMD Ryzen AI 7 350

59347 MIPS +3%

Gigabyte Gaming A16 GA6H
Intel Core i7-13620H

57536 MIPS

Average Intel Core i7-13620H
  (45983 – 62324, n=6)

56867 MIPS -1%

7z b 4 -mmt1
Lenovo LOQ 15AHP10
AMD Ryzen 7 250

6485 MIPS +11%

Medion Erazer Major 16 X1 MD62736
Intel Core Ultra 7 255HX

6439 MIPS +11%

MSI Vector 16 HX AI A2XWHG
Intel Core Ultra 7 255HX

6407 MIPS +10%

Average of class Gaming
  (4199 – 7573, n=144, last 2 years)

6387 MIPS +10%

MSI Katana 17 HX B14WGK
Intel Core i7-14650HX

6364 MIPS +9%

Gigabyte Aero X16 1WH
AMD Ryzen AI 7 350

6049 MIPS +4%

Average Intel Core i7-13620H
  (5742 – 6326, n=6)

5966 MIPS +2%

Gigabyte Gaming A16 GA6H
Intel Core i7-13620H

5825 MIPS

Geekbench 6.4
Multi-Core
Medion Erazer Major 16 X1 MD62736
Intel Core Ultra 7 255HX

18635 Points +71%

MSI Vector 16 HX AI A2XWHG
Intel Core Ultra 7 255HX

16885 Points +55%

Average of class Gaming
  (5340 – 22104, n=141, last 2 years)

15307 Points +41%

Gigabyte Aero X16 1WH
AMD Ryzen AI 7 350

14025 Points +29%

MSI Katana 17 HX B14WGK
Intel Core i7-14650HX

12892 Points +18%

Average Intel Core i7-13620H
  (9131 – 13077, n=5)

11687 Points +7%

Gigabyte Gaming A16 GA6H
Intel Core i7-13620H

10889 Points

Lenovo LOQ 15AHP10
AMD Ryzen 7 250

9956 Points -9%

Single-Core
Medion Erazer Major 16 X1 MD62736
Intel Core Ultra 7 255HX

2985 Points +19%

MSI Vector 16 HX AI A2XWHG
Intel Core Ultra 7 255HX

2923 Points +17%

Gigabyte Aero X16 1WH
AMD Ryzen AI 7 350

2863 Points +15%

Average of class Gaming
  (1490 – 3219, n=141, last 2 years)

2755 Points +10%

MSI Katana 17 HX B14WGK
Intel Core i7-14650HX

2744 Points +10%

Lenovo LOQ 15AHP10
AMD Ryzen 7 250

2586 Points +4%

Average Intel Core i7-13620H
  (2498 – 2605, n=5)

2568 Points +3%

Gigabyte Gaming A16 GA6H
Intel Core i7-13620H

2498 Points

Geekbench 5.5
Multi-Core
Medion Erazer Major 16 X1 MD62736
Intel Core Ultra 7 255HX

21014 Points +105%

MSI Vector 16 HX AI A2XWHG
Intel Core Ultra 7 255HX

18263 Points +78%

Average of class Gaming
  (4557 – 27010, n=143, last 2 years)

16313 Points +59%

MSI Katana 17 HX B14WGK
Intel Core i7-14650HX

12584 Points +23%

Gigabyte Aero X16 1WH
AMD Ryzen AI 7 350

12426 Points +21%

Average Intel Core i7-13620H
  (8357 – 12223, n=6)

10876 Points +6%

Gigabyte Gaming A16 GA6H
Intel Core i7-13620H

10255 Points

Lenovo LOQ 15AHP10
AMD Ryzen 7 250

9720 Points -5%

Single-Core
MSI Vector 16 HX AI A2XWHG
Intel Core Ultra 7 255HX

2185 Points +22%

Medion Erazer Major 16 X1 MD62736
Intel Core Ultra 7 255HX

2182 Points +22%

Gigabyte Aero X16 1WH
AMD Ryzen AI 7 350

2115 Points +18%

Average of class Gaming
  (986 – 2423, n=143, last 2 years)

1981 Points +11%

MSI Katana 17 HX B14WGK
Intel Core i7-14650HX

1940 Points +9%

Lenovo LOQ 15AHP10
AMD Ryzen 7 250

1911 Points +7%

Average Intel Core i7-13620H
  (1785 – 1865, n=6)

1817 Points +2%

Gigabyte Gaming A16 GA6H
Intel Core i7-13620H

1785 Points

HWBOT x265 Benchmark v2.2 – 4k Preset
Medion Erazer Major 16 X1 MD62736
Intel Core Ultra 7 255HX

33.6 fps +100%

MSI Vector 16 HX AI A2XWHG
Intel Core Ultra 7 255HX

30.4 fps +81%

Average of class Gaming
  (7.7 – 44.3, n=144, last 2 years)

26.2 fps +56%

Gigabyte Aero X16 1WH
AMD Ryzen AI 7 350

22.5 fps +34%

Lenovo LOQ 15AHP10
AMD Ryzen 7 250

18.1 fps +8%

Gigabyte Gaming A16 GA6H
Intel Core i7-13620H

16.8 fps

Average Intel Core i7-13620H
  (12.9 – 17.7, n=6)

16.3 fps -3%

MSI Katana 17 HX B14WGK
Intel Core i7-14650HX

12.6 fps -25%

LibreOffice – 20 Documents To PDF
MSI Katana 17 HX B14WGK
Intel Core i7-14650HX

55.6 s * -0%

Gigabyte Gaming A16 GA6H
Intel Core i7-13620H

55.5 s *

Gigabyte Aero X16 1WH
AMD Ryzen AI 7 350

53.9 s * +3%

Lenovo LOQ 15AHP10
AMD Ryzen 7 250

53.5 s * +4%

Average Intel Core i7-13620H
  (41.5 – 56.8, n=6)

49.1 s * +12%

Average of class Gaming
  (19 – 96.6, n=142, last 2 years)

47.4 s * +15%

Medion Erazer Major 16 X1 MD62736
Intel Core Ultra 7 255HX

42.9 s * +23%

MSI Vector 16 HX AI A2XWHG
Intel Core Ultra 7 255HX

40.2 s * +28%

R Benchmark 2.5 – Overall mean
Gigabyte Gaming A16 GA6H
Intel Core i7-13620H

0.4545 sec *

Average Intel Core i7-13620H
  (0.4438 – 0.4545, n=6)

0.4484 sec * +1%

Lenovo LOQ 15AHP10
AMD Ryzen 7 250

0.4471 sec * +2%

Average of class Gaming
  (0.3551 – 0.759, n=145, last 2 years)

0.4299 sec * +5%

MSI Vector 16 HX AI A2XWHG
Intel Core Ultra 7 255HX

0.4275 sec * +6%

MSI Katana 17 HX B14WGK
Intel Core i7-14650HX

0.4244 sec * +7%

Medion Erazer Major 16 X1 MD62736
Intel Core Ultra 7 255HX

0.421 sec * +7%

Gigabyte Aero X16 1WH
AMD Ryzen AI 7 350

0.4089 sec * +10%

* … smaller is better

Cinebench R15 CPU Multi 64Bit

2281 Points

Cinebench R15 OpenGL 64Bit

227 fps

Cinebench R15 Ref. Match 64Bit

99.6 %

Cinebench R15 CPU Single 64Bit

259 Points

Cinebench R20 CPU (Single Core)

705 Points

Cinebench R20 CPU (Multi Core)

5896 Points

Cinebench R23 Multi Core

15318 Points

Cinebench R23 Single Core

1833 Points

Cinebench 2024 CPU Multi Core

824 Points

Cinebench 2024 CPU Single Core

109 Points

Help

Performance Rating
Medion Erazer Major 16 X1 MD62736
Intel Core Ultra 7 255HX, GeForce RTX 5070 Ti Laptop

98.1 pt

MSI Vector 16 HX AI A2XWHG
Intel Core Ultra 7 255HX, GeForce RTX 5070 Ti Laptop

84.5 pt

Average of class Gaming
 

84.5 pt

Gigabyte Aero X16 1WH
AMD Ryzen AI 7 350, GeForce RTX 5070 Laptop

74 pt

Lenovo LOQ 15AHP10
AMD Ryzen 7 250, GeForce RTX 5060 Laptop

69.1 pt

MSI Katana 17 HX B14WGK
Intel Core i7-14650HX, GeForce RTX 5070 Laptop

51.1 pt

Average Intel Core i7-13620H
 

45.5 pt

Gigabyte Gaming A16 GA6H
Intel Core i7-13620H, GeForce RTX 5070 Laptop

44.2 pt

AIDA64 / FP32 Ray-Trace
Medion Erazer Major 16 X1 MD62736
Intel Core Ultra 7 255HX, GeForce RTX 5070 Ti Laptop

32373 KRay/s +152%

MSI Vector 16 HX AI A2XWHG
Intel Core Ultra 7 255HX, GeForce RTX 5070 Ti Laptop

27732 KRay/s +116%

Gigabyte Aero X16 1WH
AMD Ryzen AI 7 350, GeForce RTX 5070 Laptop

27546 KRay/s +114%

Average of class Gaming
  (7192 – 85542, n=143, last 2 years)

26824 KRay/s +109%

Lenovo LOQ 15AHP10
AMD Ryzen 7 250, GeForce RTX 5060 Laptop

24656 KRay/s +92%

MSI Katana 17 HX B14WGK
Intel Core i7-14650HX, GeForce RTX 5070 Laptop

13096 KRay/s +2%

Gigabyte Gaming A16 GA6H
Intel Core i7-13620H, GeForce RTX 5070 Laptop

12864 KRay/s

Average Intel Core i7-13620H
  (10779 – 13601, n=6)

12313 KRay/s -4%

AIDA64 / FPU Julia
Medion Erazer Major 16 X1 MD62736
Intel Core Ultra 7 255HX, GeForce RTX 5070 Ti Laptop

163570 Points +147%

MSI Vector 16 HX AI A2XWHG
Intel Core Ultra 7 255HX, GeForce RTX 5070 Ti Laptop

140290 Points +112%

Average of class Gaming
  (35040 – 252486, n=143, last 2 years)

123404 Points +86%

Gigabyte Aero X16 1WH
AMD Ryzen AI 7 350, GeForce RTX 5070 Laptop

106890 Points +61%

Lenovo LOQ 15AHP10
AMD Ryzen 7 250, GeForce RTX 5060 Laptop

98709 Points +49%

MSI Katana 17 HX B14WGK
Intel Core i7-14650HX, GeForce RTX 5070 Laptop

67335 Points +2%

Gigabyte Gaming A16 GA6H
Intel Core i7-13620H, GeForce RTX 5070 Laptop

66256 Points

Average Intel Core i7-13620H
  (54287 – 67187, n=6)

63413 Points -4%

AIDA64 / CPU SHA3
Medion Erazer Major 16 X1 MD62736
Intel Core Ultra 7 255HX, GeForce RTX 5070 Ti Laptop

7513 MB/s +179%

MSI Vector 16 HX AI A2XWHG
Intel Core Ultra 7 255HX, GeForce RTX 5070 Ti Laptop

6445 MB/s +139%

Average of class Gaming
  (1728 – 10389, n=143, last 2 years)

5646 MB/s +109%

Lenovo LOQ 15AHP10
AMD Ryzen 7 250, GeForce RTX 5060 Laptop

4563 MB/s +69%

Gigabyte Aero X16 1WH
AMD Ryzen AI 7 350, GeForce RTX 5070 Laptop

4322 MB/s +60%

MSI Katana 17 HX B14WGK
Intel Core i7-14650HX, GeForce RTX 5070 Laptop

3109 MB/s +15%

Gigabyte Gaming A16 GA6H
Intel Core i7-13620H, GeForce RTX 5070 Laptop

2697 MB/s

Average Intel Core i7-13620H
  (2357 – 2773, n=6)

2620 MB/s -3%

AIDA64 / CPU Queen
Medion Erazer Major 16 X1 MD62736
Intel Core Ultra 7 255HX, GeForce RTX 5070 Ti Laptop

130615 Points +71%

Average of class Gaming
  (50699 – 200651, n=143, last 2 years)

119032 Points +56%

MSI Vector 16 HX AI A2XWHG
Intel Core Ultra 7 255HX, GeForce RTX 5070 Ti Laptop

115802 Points +51%

Lenovo LOQ 15AHP10
AMD Ryzen 7 250, GeForce RTX 5060 Laptop

114915 Points +50%

MSI Katana 17 HX B14WGK
Intel Core i7-14650HX, GeForce RTX 5070 Laptop

89907 Points +18%

Gigabyte Aero X16 1WH
AMD Ryzen AI 7 350, GeForce RTX 5070 Laptop

76919 Points +1%

Gigabyte Gaming A16 GA6H
Intel Core i7-13620H, GeForce RTX 5070 Laptop

76463 Points

Average Intel Core i7-13620H
  (66885 – 78867, n=6)

76293 Points 0%

AIDA64 / FPU SinJulia
Lenovo LOQ 15AHP10
AMD Ryzen 7 250, GeForce RTX 5060 Laptop

14798 Points +81%

Average of class Gaming
  (5020 – 33636, n=143, last 2 years)

14211 Points +74%

Gigabyte Aero X16 1WH
AMD Ryzen AI 7 350, GeForce RTX 5070 Laptop

13624 Points +66%

Medion Erazer Major 16 X1 MD62736
Intel Core Ultra 7 255HX, GeForce RTX 5070 Ti Laptop

12035 Points +47%

MSI Vector 16 HX AI A2XWHG
Intel Core Ultra 7 255HX, GeForce RTX 5070 Ti Laptop

11066 Points +35%

MSI Katana 17 HX B14WGK
Intel Core i7-14650HX, GeForce RTX 5070 Laptop

9159 Points +12%

Gigabyte Gaming A16 GA6H
Intel Core i7-13620H, GeForce RTX 5070 Laptop

8190 Points

Average Intel Core i7-13620H
  (6737 – 8421, n=6)

7844 Points -4%

AIDA64 / FPU Mandel
Medion Erazer Major 16 X1 MD62736
Intel Core Ultra 7 255HX, GeForce RTX 5070 Ti Laptop

84513 Points +165%

MSI Vector 16 HX AI A2XWHG
Intel Core Ultra 7 255HX, GeForce RTX 5070 Ti Laptop

72938 Points +129%

Average of class Gaming
  (17585 – 134044, n=143, last 2 years)

63354 Points +99%

Gigabyte Aero X16 1WH
AMD Ryzen AI 7 350, GeForce RTX 5070 Laptop

57591 Points +81%

Lenovo LOQ 15AHP10
AMD Ryzen 7 250, GeForce RTX 5060 Laptop

53836 Points +69%

MSI Katana 17 HX B14WGK
Intel Core i7-14650HX, GeForce RTX 5070 Laptop

32747 Points +3%

Gigabyte Gaming A16 GA6H
Intel Core i7-13620H, GeForce RTX 5070 Laptop

31902 Points

Average Intel Core i7-13620H
  (27242 – 32787, n=6)

31013 Points -3%

AIDA64 / CPU AES
Medion Erazer Major 16 X1 MD62736
Intel Core Ultra 7 255HX, GeForce RTX 5070 Ti Laptop

112828 MB/s +102%

Average of class Gaming
  (19065 – 328679, n=143, last 2 years)

110227 MB/s +98%

MSI Vector 16 HX AI A2XWHG
Intel Core Ultra 7 255HX, GeForce RTX 5070 Ti Laptop

96832 MB/s +74%

Gigabyte Aero X16 1WH
AMD Ryzen AI 7 350, GeForce RTX 5070 Laptop

84817 MB/s +52%

Lenovo LOQ 15AHP10
AMD Ryzen 7 250, GeForce RTX 5060 Laptop

68090 MB/s +22%

MSI Katana 17 HX B14WGK
Intel Core i7-14650HX, GeForce RTX 5070 Laptop

63627 MB/s +14%

Average Intel Core i7-13620H
  (52697 – 85895, n=6)

60581 MB/s +9%

Gigabyte Gaming A16 GA6H
Intel Core i7-13620H, GeForce RTX 5070 Laptop

55809 MB/s

AIDA64 / CPU ZLib
Medion Erazer Major 16 X1 MD62736
Intel Core Ultra 7 255HX, GeForce RTX 5070 Ti Laptop

1752 MB/s +118%

MSI Vector 16 HX AI A2XWHG
Intel Core Ultra 7 255HX, GeForce RTX 5070 Ti Laptop

1510 MB/s +88%

Average of class Gaming
  (373 – 2531, n=143, last 2 years)

1491 MB/s +85%

Gigabyte Aero X16 1WH
AMD Ryzen AI 7 350, GeForce RTX 5070 Laptop

1138 MB/s +42%

Lenovo LOQ 15AHP10
AMD Ryzen 7 250, GeForce RTX 5060 Laptop

1074 MB/s +34%

MSI Katana 17 HX B14WGK
Intel Core i7-14650HX, GeForce RTX 5070 Laptop

924 MB/s +15%

Gigabyte Gaming A16 GA6H
Intel Core i7-13620H, GeForce RTX 5070 Laptop

804 MB/s

Average Intel Core i7-13620H
  (697 – 835, n=6)

783 MB/s -3%

AIDA64 / FP64 Ray-Trace
Medion Erazer Major 16 X1 MD62736
Intel Core Ultra 7 255HX, GeForce RTX 5070 Ti Laptop

17617 KRay/s +154%

MSI Vector 16 HX AI A2XWHG
Intel Core Ultra 7 255HX, GeForce RTX 5070 Ti Laptop

15137 KRay/s +119%

Gigabyte Aero X16 1WH
AMD Ryzen AI 7 350, GeForce RTX 5070 Laptop

14944 KRay/s +116%

Average of class Gaming
  (3856 – 45446, n=143, last 2 years)

14401 KRay/s +108%

Lenovo LOQ 15AHP10
AMD Ryzen 7 250, GeForce RTX 5060 Laptop

13039 KRay/s +88%

MSI Katana 17 HX B14WGK
Intel Core i7-14650HX, GeForce RTX 5070 Laptop

7064 KRay/s +2%

Gigabyte Gaming A16 GA6H
Intel Core i7-13620H, GeForce RTX 5070 Laptop

6926 KRay/s

Average Intel Core i7-13620H
  (6077 – 7364, n=6)

6745 KRay/s -3%

AIDA64 / CPU PhotoWorxx
Medion Erazer Major 16 X1 MD62736
Intel Core Ultra 7 255HX, GeForce RTX 5070 Ti Laptop

49664 MPixel/s +156%

Gigabyte Aero X16 1WH
AMD Ryzen AI 7 350, GeForce RTX 5070 Laptop

43885 MPixel/s +126%

Average of class Gaming
  (10805 – 62916, n=143, last 2 years)

42267 MPixel/s +118%

MSI Vector 16 HX AI A2XWHG
Intel Core Ultra 7 255HX, GeForce RTX 5070 Ti Laptop

39697 MPixel/s +104%

MSI Katana 17 HX B14WGK
Intel Core i7-14650HX, GeForce RTX 5070 Laptop

34470 MPixel/s +77%

Average Intel Core i7-13620H
  (19421 – 34544, n=6)

29244 MPixel/s +51%

Lenovo LOQ 15AHP10
AMD Ryzen 7 250, GeForce RTX 5060 Laptop

23228 MPixel/s +20%

Gigabyte Gaming A16 GA6H
Intel Core i7-13620H, GeForce RTX 5070 Laptop

19421 MPixel/s

When it comes to system performance, the gaps are smaller, especially since the Gaming A16 narrowly outperforms the Lenovo LOQ 15.

Performance Rating
Medion Erazer Major 16 X1 MD62736
GeForce RTX 5070 Ti Laptop, Ultra 7 255HX, Phison E31 2 TB

90 pt

Average of class Gaming
 

87.1 pt

MSI Vector 16 HX AI A2XWHG
GeForce RTX 5070 Ti Laptop, Ultra 7 255HX, Micron 2400 MTFDKBA512QFM

86.8 pt

Gigabyte Aero X16 1WH
GeForce RTX 5070 Laptop, Ryzen AI 7 350, Kingston OM8PGP41024Q-A0

83.9 pt

MSI Katana 17 HX B14WGK
GeForce RTX 5070 Laptop, i7-14650HX, Micron 2500 1TB MTFDKBA1T0QGN

81.6 pt

Gigabyte Gaming A16 GA6H
GeForce RTX 5070 Laptop, i7-13620H, Kingston OM8PGP41024Q-A0

77.4 pt

Average Intel Core i7-13620H, Nvidia GeForce RTX 5070 Laptop
 

77.4 pt

Lenovo LOQ 15AHP10 -2!
GeForce RTX 5060 Laptop, R7 250, Micron 2500 1TB MTFDKBA1T0QGN

76.6 pt

PCMark 10 / Score
Average of class Gaming
  (5776 – 9852, n=130, last 2 years)

8048 Points +18%

Gigabyte Aero X16 1WH
GeForce RTX 5070 Laptop, Ryzen AI 7 350, Kingston OM8PGP41024Q-A0

7925 Points +16%

Medion Erazer Major 16 X1 MD62736
GeForce RTX 5070 Ti Laptop, Ultra 7 255HX, Phison E31 2 TB

7858 Points +15%

MSI Vector 16 HX AI A2XWHG
GeForce RTX 5070 Ti Laptop, Ultra 7 255HX, Micron 2400 MTFDKBA512QFM

7842 Points +15%

Lenovo LOQ 15AHP10
GeForce RTX 5060 Laptop, R7 250, Micron 2500 1TB MTFDKBA1T0QGN

7304 Points +7%

MSI Katana 17 HX B14WGK
GeForce RTX 5070 Laptop, i7-14650HX, Micron 2500 1TB MTFDKBA1T0QGN

6864 Points +1%

Gigabyte Gaming A16 GA6H
GeForce RTX 5070 Laptop, i7-13620H, Kingston OM8PGP41024Q-A0

6805 Points

Average Intel Core i7-13620H, Nvidia GeForce RTX 5070 Laptop
  (n=1)

6805 Points 0%

PCMark 10 / Essentials
Average of class Gaming
  (9057 – 12600, n=130, last 2 years)

10790 Points +6%

Medion Erazer Major 16 X1 MD62736
GeForce RTX 5070 Ti Laptop, Ultra 7 255HX, Phison E31 2 TB

10773 Points +6%

MSI Vector 16 HX AI A2XWHG
GeForce RTX 5070 Ti Laptop, Ultra 7 255HX, Micron 2400 MTFDKBA512QFM

10737 Points +5%

Gigabyte Aero X16 1WH
GeForce RTX 5070 Laptop, Ryzen AI 7 350, Kingston OM8PGP41024Q-A0

10510 Points +3%

Lenovo LOQ 15AHP10
GeForce RTX 5060 Laptop, R7 250, Micron 2500 1TB MTFDKBA1T0QGN

10292 Points +1%

MSI Katana 17 HX B14WGK
GeForce RTX 5070 Laptop, i7-14650HX, Micron 2500 1TB MTFDKBA1T0QGN

10235 Points 0%

Gigabyte Gaming A16 GA6H
GeForce RTX 5070 Laptop, i7-13620H, Kingston OM8PGP41024Q-A0

10205 Points

Average Intel Core i7-13620H, Nvidia GeForce RTX 5070 Laptop
  (n=1)

10205 Points 0%

PCMark 10 / Productivity
Gigabyte Aero X16 1WH
GeForce RTX 5070 Laptop, Ryzen AI 7 350, Kingston OM8PGP41024Q-A0

10416 Points +45%

Average of class Gaming
  (6662 – 14612, n=130, last 2 years)

9861 Points +37%

MSI Vector 16 HX AI A2XWHG
GeForce RTX 5070 Ti Laptop, Ultra 7 255HX, Micron 2400 MTFDKBA512QFM

9510 Points +32%

Medion Erazer Major 16 X1 MD62736
GeForce RTX 5070 Ti Laptop, Ultra 7 255HX, Phison E31 2 TB

9270 Points +29%

Lenovo LOQ 15AHP10
GeForce RTX 5060 Laptop, R7 250, Micron 2500 1TB MTFDKBA1T0QGN

9226 Points +28%

Gigabyte Gaming A16 GA6H
GeForce RTX 5070 Laptop, i7-13620H, Kingston OM8PGP41024Q-A0

7189 Points

Average Intel Core i7-13620H, Nvidia GeForce RTX 5070 Laptop
  (n=1)

7189 Points 0%

MSI Katana 17 HX B14WGK
GeForce RTX 5070 Laptop, i7-14650HX, Micron 2500 1TB MTFDKBA1T0QGN

7091 Points -1%

PCMark 10 / Digital Content Creation
Average of class Gaming
  (7440 – 19351, n=130, last 2 years)

13468 Points +16%

Medion Erazer Major 16 X1 MD62736
GeForce RTX 5070 Ti Laptop, Ultra 7 255HX, Phison E31 2 TB

13186 Points +13%

MSI Vector 16 HX AI A2XWHG
GeForce RTX 5070 Ti Laptop, Ultra 7 255HX, Micron 2400 MTFDKBA512QFM

12817 Points +10%

Gigabyte Aero X16 1WH
GeForce RTX 5070 Laptop, Ryzen AI 7 350, Kingston OM8PGP41024Q-A0

12337 Points +6%

MSI Katana 17 HX B14WGK
GeForce RTX 5070 Laptop, i7-14650HX, Micron 2500 1TB MTFDKBA1T0QGN

12092 Points +4%

Gigabyte Gaming A16 GA6H
GeForce RTX 5070 Laptop, i7-13620H, Kingston OM8PGP41024Q-A0

11655 Points

Average Intel Core i7-13620H, Nvidia GeForce RTX 5070 Laptop
  (n=1)

11655 Points 0%

Lenovo LOQ 15AHP10
GeForce RTX 5060 Laptop, R7 250, Micron 2500 1TB MTFDKBA1T0QGN

11137 Points -4%

CrossMark / Overall
Medion Erazer Major 16 X1 MD62736
GeForce RTX 5070 Ti Laptop, Ultra 7 255HX, Phison E31 2 TB

2097 Points +15%

Average of class Gaming
  (1247 – 2344, n=112, last 2 years)

1968 Points +8%

MSI Katana 17 HX B14WGK
GeForce RTX 5070 Laptop, i7-14650HX, Micron 2500 1TB MTFDKBA1T0QGN

1965 Points +8%

MSI Vector 16 HX AI A2XWHG
GeForce RTX 5070 Ti Laptop, Ultra 7 255HX, Micron 2400 MTFDKBA512QFM

1944 Points +7%

Gigabyte Gaming A16 GA6H
GeForce RTX 5070 Laptop, i7-13620H, Kingston OM8PGP41024Q-A0

1816 Points

Average Intel Core i7-13620H, Nvidia GeForce RTX 5070 Laptop
  (n=1)

1816 Points 0%

Gigabyte Aero X16 1WH
GeForce RTX 5070 Laptop, Ryzen AI 7 350, Kingston OM8PGP41024Q-A0

1752 Points -4%

Lenovo LOQ 15AHP10
GeForce RTX 5060 Laptop, R7 250, Micron 2500 1TB MTFDKBA1T0QGN

1746 Points -4%

CrossMark / Productivity
Medion Erazer Major 16 X1 MD62736
GeForce RTX 5070 Ti Laptop, Ultra 7 255HX, Phison E31 2 TB

1959 Points +10%

MSI Katana 17 HX B14WGK
GeForce RTX 5070 Laptop, i7-14650HX, Micron 2500 1TB MTFDKBA1T0QGN

1892 Points +6%

Average of class Gaming
  (1299 – 2211, n=112, last 2 years)

1854 Points +4%

MSI Vector 16 HX AI A2XWHG
GeForce RTX 5070 Ti Laptop, Ultra 7 255HX, Micron 2400 MTFDKBA512QFM

1845 Points +4%

Gigabyte Gaming A16 GA6H
GeForce RTX 5070 Laptop, i7-13620H, Kingston OM8PGP41024Q-A0

1781 Points

Average Intel Core i7-13620H, Nvidia GeForce RTX 5070 Laptop
  (n=1)

1781 Points 0%

Lenovo LOQ 15AHP10
GeForce RTX 5060 Laptop, R7 250, Micron 2500 1TB MTFDKBA1T0QGN

1764 Points -1%

Gigabyte Aero X16 1WH
GeForce RTX 5070 Laptop, Ryzen AI 7 350, Kingston OM8PGP41024Q-A0

1664 Points -7%

CrossMark / Creativity
Medion Erazer Major 16 X1 MD62736
GeForce RTX 5070 Ti Laptop, Ultra 7 255HX, Phison E31 2 TB

2400 Points +30%

MSI Vector 16 HX AI A2XWHG
GeForce RTX 5070 Ti Laptop, Ultra 7 255HX, Micron 2400 MTFDKBA512QFM

2249 Points +22%

Average of class Gaming
  (1275 – 2729, n=112, last 2 years)

2188 Points +18%

MSI Katana 17 HX B14WGK
GeForce RTX 5070 Laptop, i7-14650HX, Micron 2500 1TB MTFDKBA1T0QGN

2050 Points +11%

Gigabyte Aero X16 1WH
GeForce RTX 5070 Laptop, Ryzen AI 7 350, Kingston OM8PGP41024Q-A0

1959 Points +6%

Gigabyte Gaming A16 GA6H
GeForce RTX 5070 Laptop, i7-13620H, Kingston OM8PGP41024Q-A0

1847 Points

Average Intel Core i7-13620H, Nvidia GeForce RTX 5070 Laptop
  (n=1)

1847 Points 0%

Lenovo LOQ 15AHP10
GeForce RTX 5060 Laptop, R7 250, Micron 2500 1TB MTFDKBA1T0QGN

1757 Points -5%

CrossMark / Responsiveness
MSI Katana 17 HX B14WGK
GeForce RTX 5070 Laptop, i7-14650HX, Micron 2500 1TB MTFDKBA1T0QGN

1937 Points +6%

Gigabyte Gaming A16 GA6H
GeForce RTX 5070 Laptop, i7-13620H, Kingston OM8PGP41024Q-A0

1830 Points

Average Intel Core i7-13620H, Nvidia GeForce RTX 5070 Laptop
  (n=1)

1830 Points 0%

Average of class Gaming
  (1030 – 2330, n=112, last 2 years)

1729 Points -6%

Medion Erazer Major 16 X1 MD62736
GeForce RTX 5070 Ti Laptop, Ultra 7 255HX, Phison E31 2 TB

1713 Points -6%

Lenovo LOQ 15AHP10
GeForce RTX 5060 Laptop, R7 250, Micron 2500 1TB MTFDKBA1T0QGN

1664 Points -9%

MSI Vector 16 HX AI A2XWHG
GeForce RTX 5070 Ti Laptop, Ultra 7 255HX, Micron 2400 MTFDKBA512QFM

1468 Points -20%

Gigabyte Aero X16 1WH
GeForce RTX 5070 Laptop, Ryzen AI 7 350, Kingston OM8PGP41024Q-A0

1461 Points -20%

WebXPRT 3 / Overall
Gigabyte Aero X16 1WH
GeForce RTX 5070 Laptop, Ryzen AI 7 350, Kingston OM8PGP41024Q-A0

336 Points +24%

Medion Erazer Major 16 X1 MD62736
GeForce RTX 5070 Ti Laptop, Ultra 7 255HX, Phison E31 2 TB

325 Points +20%

MSI Vector 16 HX AI A2XWHG
GeForce RTX 5070 Ti Laptop, Ultra 7 255HX, Micron 2400 MTFDKBA512QFM

319 Points +18%

Average of class Gaming
  (237 – 532, n=124, last 2 years)

314 Points +16%

MSI Katana 17 HX B14WGK
GeForce RTX 5070 Laptop, i7-14650HX, Micron 2500 1TB MTFDKBA1T0QGN

289 Points +7%

Gigabyte Gaming A16 GA6H
GeForce RTX 5070 Laptop, i7-13620H, Kingston OM8PGP41024Q-A0

271 Points

Average Intel Core i7-13620H, Nvidia GeForce RTX 5070 Laptop
  (n=1)

271 Points 0%

WebXPRT 4 / Overall
Medion Erazer Major 16 X1 MD62736
GeForce RTX 5070 Ti Laptop, Ultra 7 255HX, Phison E31 2 TB

306 Points +18%

MSI Vector 16 HX AI A2XWHG
GeForce RTX 5070 Ti Laptop, Ultra 7 255HX, Micron 2400 MTFDKBA512QFM

305 Points +17%

Average of class Gaming
  (176.4 – 341, n=111, last 2 years)

280 Points +8%

Gigabyte Aero X16 1WH
GeForce RTX 5070 Laptop, Ryzen AI 7 350, Kingston OM8PGP41024Q-A0

277 Points +7%

MSI Katana 17 HX B14WGK
GeForce RTX 5070 Laptop, i7-14650HX, Micron 2500 1TB MTFDKBA1T0QGN

271 Points +4%

Gigabyte Gaming A16 GA6H
GeForce RTX 5070 Laptop, i7-13620H, Kingston OM8PGP41024Q-A0

260 Points

Average Intel Core i7-13620H, Nvidia GeForce RTX 5070 Laptop
  (n=1)

260 Points 0%

Mozilla Kraken 1.1 / Total
Lenovo LOQ 15AHP10
GeForce RTX 5060 Laptop, R7 250, Micron 2500 1TB MTFDKBA1T0QGN

534 ms * -2%

Gigabyte Gaming A16 GA6H
GeForce RTX 5070 Laptop, i7-13620H, Kingston OM8PGP41024Q-A0

521 ms *

Average Intel Core i7-13620H, Nvidia GeForce RTX 5070 Laptop
  (n=1)

521 ms * -0%

MSI Katana 17 HX B14WGK
GeForce RTX 5070 Laptop, i7-14650HX, Micron 2500 1TB MTFDKBA1T0QGN

483 ms * +7%

Average of class Gaming
  (397 – 674, n=134, last 2 years)

481 ms * +8%

Gigabyte Aero X16 1WH
GeForce RTX 5070 Laptop, Ryzen AI 7 350, Kingston OM8PGP41024Q-A0

431 ms * +17%

MSI Vector 16 HX AI A2XWHG
GeForce RTX 5070 Ti Laptop, Ultra 7 255HX, Micron 2400 MTFDKBA512QFM

425 ms * +18%

Medion Erazer Major 16 X1 MD62736
GeForce RTX 5070 Ti Laptop, Ultra 7 255HX, Phison E31 2 TB

425 ms * +18%

* … smaller is better

PCMark 10 Score 6805 points

Help

AIDA64 / Memory Copy
Medion Erazer Major 16 X1 MD62736
Intel Core Ultra 7 255HX, GeForce RTX 5070 Ti Laptop

77224 MB/s +144%

Gigabyte Aero X16 1WH
AMD Ryzen AI 7 350, GeForce RTX 5070 Laptop

73142 MB/s +131%

Average of class Gaming
  (21750 – 97515, n=143, last 2 years)

69840 MB/s +121%

MSI Vector 16 HX AI A2XWHG
Intel Core Ultra 7 255HX, GeForce RTX 5070 Ti Laptop

68939 MB/s +118%

MSI Katana 17 HX B14WGK
Intel Core i7-14650HX, GeForce RTX 5070 Laptop

58978 MB/s +86%

Average Intel Core i7-13620H
  (31629 – 53927, n=6)

46982 MB/s +49%

Lenovo LOQ 15AHP10
AMD Ryzen 7 250, GeForce RTX 5060 Laptop

35838 MB/s +13%

Gigabyte Gaming A16 GA6H
Intel Core i7-13620H, GeForce RTX 5070 Laptop

31629 MB/s

AIDA64 / Memory Read
Medion Erazer Major 16 X1 MD62736
Intel Core Ultra 7 255HX, GeForce RTX 5070 Ti Laptop

85818 MB/s +144%

MSI Vector 16 HX AI A2XWHG
Intel Core Ultra 7 255HX, GeForce RTX 5070 Ti Laptop

82336 MB/s +134%

Average of class Gaming
  (22956 – 104349, n=143, last 2 years)

73013 MB/s +108%

MSI Katana 17 HX B14WGK
Intel Core i7-14650HX, GeForce RTX 5070 Laptop

70720 MB/s +101%

Gigabyte Aero X16 1WH
AMD Ryzen AI 7 350, GeForce RTX 5070 Laptop

62290 MB/s +77%

Average Intel Core i7-13620H
  (35115 – 61853, n=6)

53236 MB/s +52%

Gigabyte Gaming A16 GA6H
Intel Core i7-13620H, GeForce RTX 5070 Laptop

35115 MB/s

Lenovo LOQ 15AHP10
AMD Ryzen 7 250, GeForce RTX 5060 Laptop

30770 MB/s -12%

AIDA64 / Memory Write
Medion Erazer Major 16 X1 MD62736
Intel Core Ultra 7 255HX, GeForce RTX 5070 Ti Laptop

133486 MB/s +336%

Gigabyte Aero X16 1WH
AMD Ryzen AI 7 350, GeForce RTX 5070 Laptop

86056 MB/s +181%

Average of class Gaming
  (22297 – 133486, n=143, last 2 years)

72053 MB/s +135%

MSI Vector 16 HX AI A2XWHG
Intel Core Ultra 7 255HX, GeForce RTX 5070 Ti Laptop

66479 MB/s +117%

MSI Katana 17 HX B14WGK
Intel Core i7-14650HX, GeForce RTX 5070 Laptop

56811 MB/s +86%

Average Intel Core i7-13620H
  (30611 – 54111, n=6)

46535 MB/s +52%

Lenovo LOQ 15AHP10
AMD Ryzen 7 250, GeForce RTX 5060 Laptop

42376 MB/s +38%

Gigabyte Gaming A16 GA6H
Intel Core i7-13620H, GeForce RTX 5070 Laptop

30611 MB/s

AIDA64 / Memory Latency
Medion Erazer Major 16 X1 MD62736
Intel Core Ultra 7 255HX, GeForce RTX 5070 Ti Laptop

110 ns * -7%

MSI Vector 16 HX AI A2XWHG
Intel Core Ultra 7 255HX, GeForce RTX 5070 Ti Laptop

106.4 ns * -3%

Gigabyte Gaming A16 GA6H
Intel Core i7-13620H, GeForce RTX 5070 Laptop

103.2 ns *

Average Intel Core i7-13620H
  (75.9 – 108.2, n=6)

100.4 ns * +3%

Average of class Gaming
  (59.5 – 259, n=143, last 2 years)

100.2 ns * +3%

Lenovo LOQ 15AHP10
AMD Ryzen 7 250, GeForce RTX 5060 Laptop

98.4 ns * +5%

Gigabyte Aero X16 1WH
AMD Ryzen AI 7 350, GeForce RTX 5070 Laptop

97.2 ns * +6%

MSI Katana 17 HX B14WGK
Intel Core i7-14650HX, GeForce RTX 5070 Laptop

95.2 ns * +8%

* … smaller is better

At the moment, latency is a weak point for almost every Windows laptop, and the Gigabyte model doesn’t exactly perform well in this category either.

DPC Latencies / LatencyMon – interrupt to process latency (max), Web, Youtube, Prime95
MSI Katana 17 HX B14WGK
GeForce RTX 5070 Laptop, i7-14650HX, Micron 2500 1TB MTFDKBA1T0QGN

5077 μs * -20%

MSI Vector 16 HX AI A2XWHG
GeForce RTX 5070 Ti Laptop, Ultra 7 255HX, Micron 2400 MTFDKBA512QFM

4544 μs * -8%

Gigabyte Gaming A16 GA6H
GeForce RTX 5070 Laptop, i7-13620H, Kingston OM8PGP41024Q-A0

4219 μs *

Medion Erazer Major 16 X1 MD62736
GeForce RTX 5070 Ti Laptop, Ultra 7 255HX, Phison E31 2 TB

3213 μs * +24%

Gigabyte Aero X16 1WH
GeForce RTX 5070 Laptop, Ryzen AI 7 350, Kingston OM8PGP41024Q-A0

2123.1 μs * +50%

Lenovo LOQ 15AHP10
GeForce RTX 5060 Laptop, R7 250, Micron 2500 1TB MTFDKBA1T0QGN

1229.6 μs * +71%

* … smaller is better

In the DiskSpd loop, the Gaming A16 unfortunately fell short of the LOQ 15, which also struggles with SSD speed throttling over time. Other than that, the Kingston NVMe drive delivered mediocre performance (see table).

CDM 5/6 Read Seq Q32T1: 4794 MB/s

CDM 5/6 Write Seq Q32T1: 3910 MB/s

CDM 5/6 Read 4K Q32T1: 632.7 MB/s

CDM 5/6 Write 4K Q32T1: 561.8 MB/s

CDM 5 Read Seq: 2583 MB/s

CDM 5 Write Seq: 3915 MB/s

CDM 5/6 Read 4K: 78.71 MB/s

CDM 5/6 Write 4K: 331.7 MB/s

Drive Performance Rating – Percent
MSI Katana 17 HX B14WGK
Micron 2500 1TB MTFDKBA1T0QGN

84.1 pt

Lenovo LOQ 15AHP10
Micron 2500 1TB MTFDKBA1T0QGN

82.9 pt

Medion Erazer Major 16 X1 MD62736
Phison E31 2 TB

75.8 pt

Gigabyte Gaming A16 GA6H
Kingston OM8PGP41024Q-A0

75.2 pt

Gigabyte Aero X16 1WH
Kingston OM8PGP41024Q-A0

73.4 pt

Average of class Gaming
 

71.6 pt

Average Kingston OM8PGP41024Q-A0
 

60.6 pt

MSI Vector 16 HX AI A2XWHG
Micron 2400 MTFDKBA512QFM

34.6 pt

DiskSpd
seq read
Medion Erazer Major 16 X1 MD62736
Phison E31 2 TB

4499 (4406.95min – 4499.46max) MB/s +85%

Lenovo LOQ 15AHP10
Micron 2500 1TB MTFDKBA1T0QGN

3632 (3569.55min – 3631.92max) MB/s +50%

Average of class Gaming
  (281 – 8300, n=126, last 2 years)

3476 MB/s +43%

MSI Katana 17 HX B14WGK
Micron 2500 1TB MTFDKBA1T0QGN

3341 (3301.65min – 3341max) MB/s +38%

Average Kingston OM8PGP41024Q-A0
  (1243 – 3327, n=14)

2635 MB/s +8%

Gigabyte Aero X16 1WH
Kingston OM8PGP41024Q-A0

2508 (1821.45min – 2508max) MB/s +3%

Gigabyte Gaming A16 GA6H
Kingston OM8PGP41024Q-A0

2429 (2393.52min – 2428.5max) MB/s

MSI Vector 16 HX AI A2XWHG
Micron 2400 MTFDKBA512QFM

2149 (1298.27min – 2149.37max) MB/s -12%

seq write
Lenovo LOQ 15AHP10
Micron 2500 1TB MTFDKBA1T0QGN

5256 (5197.58min – 5255.67max) MB/s +40%

MSI Katana 17 HX B14WGK
Micron 2500 1TB MTFDKBA1T0QGN

4764 (4694.94min – 4764.01max) MB/s +27%

Medion Erazer Major 16 X1 MD62736
Phison E31 2 TB

4487 (3748.71min – 4486.69max) MB/s +19%

Average of class Gaming
  (1247 – 9699, n=126, last 2 years)

3988 MB/s +6%

Gigabyte Aero X16 1WH
Kingston OM8PGP41024Q-A0

3905 (2240.1min – 3904.64max) MB/s +4%

Gigabyte Gaming A16 GA6H
Kingston OM8PGP41024Q-A0

3756 (3683.41min – 3756.04max) MB/s

Average Kingston OM8PGP41024Q-A0
  (977 – 3913, n=14)

3519 MB/s -6%

MSI Vector 16 HX AI A2XWHG
Micron 2400 MTFDKBA512QFM

1626 (1509.24min – 1625.61max) MB/s -57%

seq q8 t1 read
Medion Erazer Major 16 X1 MD62736
Phison E31 2 TB

9757 (7653.14min – 9756.57max) MB/s +105%

Lenovo LOQ 15AHP10
Micron 2500 1TB MTFDKBA1T0QGN

7004 (5842.1min – 7004.24max) MB/s +47%

MSI Katana 17 HX B14WGK
Micron 2500 1TB MTFDKBA1T0QGN

6825 (6121.3min – 6824.97max) MB/s +44%

Average of class Gaming
  (2605 – 15056, n=126, last 2 years)

6746 MB/s +42%

Gigabyte Aero X16 1WH
Kingston OM8PGP41024Q-A0

4821 (4294.34min – 4820.52max) MB/s +2%

Gigabyte Gaming A16 GA6H
Kingston OM8PGP41024Q-A0

4749 (4322.02min – 4748.79max) MB/s

MSI Vector 16 HX AI A2XWHG
Micron 2400 MTFDKBA512QFM

4602 (4035.76min – 4602.22max) MB/s -3%

Average Kingston OM8PGP41024Q-A0
  (1754 – 4821, n=14)

4558 MB/s -4%

seq q8 t1 write
Medion Erazer Major 16 X1 MD62736
Phison E31 2 TB

7691 (7534.86min – 7691.1max) MB/s +99%

Lenovo LOQ 15AHP10
Micron 2500 1TB MTFDKBA1T0QGN

6103 (6005.82min – 6102.92max) MB/s +58%

MSI Katana 17 HX B14WGK
Micron 2500 1TB MTFDKBA1T0QGN

5472 (5372.64min – 5472.14max) MB/s +41%

Average of class Gaming
  (1281 – 13519, n=126, last 2 years)

5330 MB/s +38%

Gigabyte Aero X16 1WH
Kingston OM8PGP41024Q-A0

3915 (3898.36min – 3915.17max) MB/s +1%

Gigabyte Gaming A16 GA6H
Kingston OM8PGP41024Q-A0

3873 (3818.91min – 3872.62max) MB/s

Average Kingston OM8PGP41024Q-A0
  (982 – 3927, n=14)

3650 MB/s -6%

MSI Vector 16 HX AI A2XWHG
Micron 2400 MTFDKBA512QFM

1808 (1700.58min – 1807.9max) MB/s -53%

4k q1 t1 read
MSI Katana 17 HX B14WGK
Micron 2500 1TB MTFDKBA1T0QGN

78.8 (77.09min – 78.83max) MB/s +8%

Lenovo LOQ 15AHP10
Micron 2500 1TB MTFDKBA1T0QGN

76.5 (75.54min – 76.49max) MB/s +5%

Medion Erazer Major 16 X1 MD62736
Phison E31 2 TB

74.1 (73.06min – 74.09max) MB/s +2%

Gigabyte Gaming A16 GA6H
Kingston OM8PGP41024Q-A0

73 (72.21min – 73.01max) MB/s

Average of class Gaming
  (32.2 – 110.2, n=126, last 2 years)

68.4 MB/s -6%

Gigabyte Aero X16 1WH
Kingston OM8PGP41024Q-A0

66.5 (65.03min – 66.52max) MB/s -9%

Average Kingston OM8PGP41024Q-A0
  (44.9 – 81.1, n=14)

63.3 MB/s -13%

MSI Vector 16 HX AI A2XWHG
Micron 2400 MTFDKBA512QFM

32.2 (32.04min – 32.19max) MB/s -56%

4k q1 t1 write
Gigabyte Gaming A16 GA6H
Kingston OM8PGP41024Q-A0

333 (326.87min – 332.75max) MB/s

MSI Katana 17 HX B14WGK
Micron 2500 1TB MTFDKBA1T0QGN

329 (290.58min – 328.88max) MB/s -1%

Gigabyte Aero X16 1WH
Kingston OM8PGP41024Q-A0

255 (218.03min – 254.91max) MB/s -23%

Lenovo LOQ 15AHP10
Micron 2500 1TB MTFDKBA1T0QGN

247 (242.52min – 246.64max) MB/s -26%

Average Kingston OM8PGP41024Q-A0
  (81 – 435, n=14)

234 MB/s -30%

Average of class Gaming
  (78 – 397, n=126, last 2 years)

216 MB/s -35%

Medion Erazer Major 16 X1 MD62736
Phison E31 2 TB

160.9 (157.16min – 160.9max) MB/s -52%

MSI Vector 16 HX AI A2XWHG
Micron 2400 MTFDKBA512QFM

128 (121.34min – 128.01max) MB/s -62%

4k q32 t16 read
Lenovo LOQ 15AHP10
Micron 2500 1TB MTFDKBA1T0QGN

4137 (4111.19min – 4136.71max) MB/s +48%

MSI Katana 17 HX B14WGK
Micron 2500 1TB MTFDKBA1T0QGN

3742 (3709.52min – 3742.29max) MB/s +34%

Gigabyte Aero X16 1WH
Kingston OM8PGP41024Q-A0

2919 (2877.27min – 2918.5max) MB/s +5%

Gigabyte Gaming A16 GA6H
Kingston OM8PGP41024Q-A0

2793 (2764.32min – 2793.37max) MB/s

Average of class Gaming
  (417 – 8067, n=126, last 2 years)

2578 MB/s -8%

Average Kingston OM8PGP41024Q-A0
  (434 – 2980, n=14)

2054 MB/s -26%

Medion Erazer Major 16 X1 MD62736
Phison E31 2 TB

955 (939.34min – 955.43max) MB/s -66%

MSI Vector 16 HX AI A2XWHG
Micron 2400 MTFDKBA512QFM

718 (699.38min – 717.55max) MB/s -74%

4k q32 t16 write
Gigabyte Aero X16 1WH
Kingston OM8PGP41024Q-A0

3730 (3655.4min – 3730.3max) MB/s +22%

Lenovo LOQ 15AHP10
Micron 2500 1TB MTFDKBA1T0QGN

3371 (3357.07min – 3370.53max) MB/s +10%

Gigabyte Gaming A16 GA6H
Kingston OM8PGP41024Q-A0

3060 (3036.18min – 3059.66max) MB/s

MSI Katana 17 HX B14WGK
Micron 2500 1TB MTFDKBA1T0QGN

2613 (2166.16min – 2612.82max) MB/s -15%

Average of class Gaming
  (162.3 – 5653, n=126, last 2 years)

2103 MB/s -31%

Average Kingston OM8PGP41024Q-A0
  (203 – 3784, n=14)

1999 MB/s -35%

MSI Vector 16 HX AI A2XWHG
Micron 2400 MTFDKBA512QFM

498 (400.43min – 497.63max) MB/s -84%

Medion Erazer Major 16 X1 MD62736
Phison E31 2 TB

458 (439.11min – 457.66max) MB/s -85%

AS SSD
Score Total
Lenovo LOQ 15AHP10
Micron 2500 1TB MTFDKBA1T0QGN

8387 Points +9%

Gigabyte Gaming A16 GA6H
Kingston OM8PGP41024Q-A0

7681 Points

MSI Katana 17 HX B14WGK
Micron 2500 1TB MTFDKBA1T0QGN

7570 Points -1%

Gigabyte Aero X16 1WH
Kingston OM8PGP41024Q-A0

7205 Points -6%

Average of class Gaming
  (2782 – 13854, n=124, last 2 years)

6884 Points -10%

Medion Erazer Major 16 X1 MD62736
Phison E31 2 TB

6647 Points -13%

Average Kingston OM8PGP41024Q-A0
  (1166 – 8405, n=14)

5674 Points -26%

MSI Vector 16 HX AI A2XWHG
Micron 2400 MTFDKBA512QFM

3599 Points -53%

Score Read
Lenovo LOQ 15AHP10
Micron 2500 1TB MTFDKBA1T0QGN

3093 Points +13%

MSI Katana 17 HX B14WGK
Micron 2500 1TB MTFDKBA1T0QGN

3014 Points +11%

Gigabyte Aero X16 1WH
Kingston OM8PGP41024Q-A0

2867 Points +5%

Gigabyte Gaming A16 GA6H
Kingston OM8PGP41024Q-A0

2727 Points

Average of class Gaming
  (776 – 4721, n=124, last 2 years)

2394 Points -12%

Average Kingston OM8PGP41024Q-A0
  (571 – 2901, n=14)

1939 Points -29%

Medion Erazer Major 16 X1 MD62736
Phison E31 2 TB

1764 Points -35%

MSI Vector 16 HX AI A2XWHG
Micron 2400 MTFDKBA512QFM

1460 Points -46%

Score Write
Medion Erazer Major 16 X1 MD62736
Phison E31 2 TB

4078 Points +14%

Lenovo LOQ 15AHP10
Micron 2500 1TB MTFDKBA1T0QGN

3725 Points +4%

Gigabyte Gaming A16 GA6H
Kingston OM8PGP41024Q-A0

3573 Points

Average of class Gaming
  (989 – 7208, n=124, last 2 years)

3331 Points -7%

MSI Katana 17 HX B14WGK
Micron 2500 1TB MTFDKBA1T0QGN

3025 Points -15%

Gigabyte Aero X16 1WH
Kingston OM8PGP41024Q-A0

2888 Points -19%

Average Kingston OM8PGP41024Q-A0
  (331 – 4040, n=14)

2775 Points -22%

MSI Vector 16 HX AI A2XWHG
Micron 2400 MTFDKBA512QFM

1502 Points -58%

Seq Read
Medion Erazer Major 16 X1 MD62736
Phison E31 2 TB

6830.03 MB/s +69%

MSI Katana 17 HX B14WGK
Micron 2500 1TB MTFDKBA1T0QGN

5599.48 MB/s +39%

Lenovo LOQ 15AHP10
Micron 2500 1TB MTFDKBA1T0QGN

5402.1 MB/s +34%

Average of class Gaming
  (2260 – 9890, n=124, last 2 years)

5190 MB/s +29%

Gigabyte Aero X16 1WH
Kingston OM8PGP41024Q-A0

4042 MB/s 0%

Gigabyte Gaming A16 GA6H
Kingston OM8PGP41024Q-A0

4036.28 MB/s

MSI Vector 16 HX AI A2XWHG
Micron 2400 MTFDKBA512QFM

3707.36 MB/s -8%

Average Kingston OM8PGP41024Q-A0
  (1474 – 4193, n=14)

3617 MB/s -10%

Seq Write
Lenovo LOQ 15AHP10
Micron 2500 1TB MTFDKBA1T0QGN

5036.34 MB/s +45%

MSI Katana 17 HX B14WGK
Micron 2500 1TB MTFDKBA1T0QGN

4998.6 MB/s +44%

Medion Erazer Major 16 X1 MD62736
Phison E31 2 TB

4481.02 MB/s +29%

Average of class Gaming
  (1215 – 9926, n=124, last 2 years)

4004 MB/s +15%

Gigabyte Aero X16 1WH
Kingston OM8PGP41024Q-A0

3558 MB/s +2%

Gigabyte Gaming A16 GA6H
Kingston OM8PGP41024Q-A0

3474.09 MB/s

Average Kingston OM8PGP41024Q-A0
  (648 – 3688, n=14)

2717 MB/s -22%

MSI Vector 16 HX AI A2XWHG
Micron 2400 MTFDKBA512QFM

1432.7 MB/s -59%

4K Read
MSI Katana 17 HX B14WGK
Micron 2500 1TB MTFDKBA1T0QGN

108.36 MB/s +19%

Gigabyte Gaming A16 GA6H
Kingston OM8PGP41024Q-A0

90.83 MB/s

Gigabyte Aero X16 1WH
Kingston OM8PGP41024Q-A0

82.1 MB/s -10%

Lenovo LOQ 15AHP10
Micron 2500 1TB MTFDKBA1T0QGN

79.42 MB/s -13%

Medion Erazer Major 16 X1 MD62736
Phison E31 2 TB

79.06 MB/s -13%

Average Kingston OM8PGP41024Q-A0
  (41.2 – 90.8, n=14)

71.5 MB/s -21%

Average of class Gaming
  (27.8 – 108.4, n=124, last 2 years)

67.6 MB/s -26%

MSI Vector 16 HX AI A2XWHG
Micron 2400 MTFDKBA512QFM

42.82 MB/s -53%

4K Write
MSI Katana 17 HX B14WGK
Micron 2500 1TB MTFDKBA1T0QGN

306.65 MB/s +11%

Gigabyte Gaming A16 GA6H
Kingston OM8PGP41024Q-A0

275.03 MB/s

Medion Erazer Major 16 X1 MD62736
Phison E31 2 TB

241.33 MB/s -12%

Gigabyte Aero X16 1WH
Kingston OM8PGP41024Q-A0

227 MB/s -17%

MSI Vector 16 HX AI A2XWHG
Micron 2400 MTFDKBA512QFM

222.05 MB/s -19%

Average Kingston OM8PGP41024Q-A0
  (82.5 – 275, n=14)

218 MB/s -21%

Average of class Gaming
  (75.6 – 512, n=124, last 2 years)

216 MB/s -21%

Lenovo LOQ 15AHP10
Micron 2500 1TB MTFDKBA1T0QGN

75.56 MB/s -73%

4K-64 Read
Lenovo LOQ 15AHP10
Micron 2500 1TB MTFDKBA1T0QGN

2473.44 MB/s +11%

Gigabyte Aero X16 1WH
Kingston OM8PGP41024Q-A0

2381 MB/s +7%

MSI Katana 17 HX B14WGK
Micron 2500 1TB MTFDKBA1T0QGN

2345.63 MB/s +5%

Gigabyte Gaming A16 GA6H
Kingston OM8PGP41024Q-A0

2232.85 MB/s

Average of class Gaming
  (451 – 3630, n=124, last 2 years)

1801 MB/s -19%

Average Kingston OM8PGP41024Q-A0
  (382 – 2409, n=14)

1505 MB/s -33%

MSI Vector 16 HX AI A2XWHG
Micron 2400 MTFDKBA512QFM

1045.95 MB/s -53%

Medion Erazer Major 16 X1 MD62736
Phison E31 2 TB

1002.25 MB/s -55%

4K-64 Write
Medion Erazer Major 16 X1 MD62736
Phison E31 2 TB

3388.68 MB/s +15%

Lenovo LOQ 15AHP10
Micron 2500 1TB MTFDKBA1T0QGN

3146.3 MB/s +7%

Gigabyte Gaming A16 GA6H
Kingston OM8PGP41024Q-A0

2950.37 MB/s

Average of class Gaming
  (521 – 5909, n=124, last 2 years)

2718 MB/s -8%

Gigabyte Aero X16 1WH
Kingston OM8PGP41024Q-A0

2305 MB/s -22%

Average Kingston OM8PGP41024Q-A0
  (183.4 – 3492, n=14)

2286 MB/s -23%

MSI Katana 17 HX B14WGK
Micron 2500 1TB MTFDKBA1T0QGN

2218.04 MB/s -25%

MSI Vector 16 HX AI A2XWHG
Micron 2400 MTFDKBA512QFM

1136.85 MB/s -61%

Access Time Read
MSI Vector 16 HX AI A2XWHG
Micron 2400 MTFDKBA512QFM

0.123 ms * -86%

Average Kingston OM8PGP41024Q-A0
  (0.036 – 0.127, n=14)

0.07536 ms * -14%

Lenovo LOQ 15AHP10
Micron 2500 1TB MTFDKBA1T0QGN

0.075 ms * -14%

MSI Katana 17 HX B14WGK
Micron 2500 1TB MTFDKBA1T0QGN

0.073 ms * -11%

Gigabyte Gaming A16 GA6H
Kingston OM8PGP41024Q-A0

0.066 ms *

Average of class Gaming
  (0.016 – 0.379, n=124, last 2 years)

0.05606 ms * +15%

Gigabyte Aero X16 1WH
Kingston OM8PGP41024Q-A0

0.036 ms * +45%

Medion Erazer Major 16 X1 MD62736
Phison E31 2 TB

0.03 ms * +55%

Access Time Write
MSI Vector 16 HX AI A2XWHG
Micron 2400 MTFDKBA512QFM

0.103 ms * -232%

Average of class Gaming
  (0.012 – 0.29, n=124, last 2 years)

0.03998 ms * -29%

Average Kingston OM8PGP41024Q-A0
  (0.02 – 0.06, n=14)

0.03214 ms * -4%

Gigabyte Aero X16 1WH
Kingston OM8PGP41024Q-A0

0.032 ms * -3%

Gigabyte Gaming A16 GA6H
Kingston OM8PGP41024Q-A0

0.031 ms *

Lenovo LOQ 15AHP10
Micron 2500 1TB MTFDKBA1T0QGN

0.019 ms * +39%

Medion Erazer Major 16 X1 MD62736
Phison E31 2 TB

0.016 ms * +48%

MSI Katana 17 HX B14WGK
Micron 2500 1TB MTFDKBA1T0QGN

0.012 ms * +61%

* … smaller is better

0515103015452060257530903605412046355150566561806695721077258240875592709785Tooltip

Hardly any graphics cards in the laptop segment are currently as hotly debated as the GeForce RTX 5070. While the Ti model boasts 12 GB of VRAM, the standard version has to make do with a meager 8 GB, especially since Gigabyte has limited the TGP to 85 watts, including Dynamic Boost. This latter decision, in particular, didn’t lead to top results in the synthetic tests. The Gaming A16 fell slightly below the average score recorded so far for this graphics card and was barely able to distinguish itself from the RTX 5060 in the cheaper Lenovo LOQ 15.

3DMark Performance Rating – Percent
Medion Erazer Major 16 X1 MD62736
Nvidia GeForce RTX 5070 Ti Laptop

100 pt

MSI Vector 16 HX AI A2XWHG
Nvidia GeForce RTX 5070 Ti Laptop

95.1 pt

Average of class Gaming
 

83.2 pt

Average Nvidia GeForce RTX 5070 Laptop
 

75.2 pt

MSI Katana 17 HX B14WGK
Nvidia GeForce RTX 5070 Laptop

74.1 pt

Gigabyte Gaming A16 GA6H
Nvidia GeForce RTX 5070 Laptop

70.8 pt

Lenovo LOQ 15AHP10
Nvidia GeForce RTX 5060 Laptop

69.8 pt

Gigabyte Aero X16 1WH
Nvidia GeForce RTX 5070 Laptop

69.1 pt

3DMark 11 – 1280×720 Performance GPU
Medion Erazer Major 16 X1 MD62736
Nvidia GeForce RTX 5070 Ti Laptop

59227 Points +40%

MSI Vector 16 HX AI A2XWHG
Nvidia GeForce RTX 5070 Ti Laptop

56824 Points +35%

Average of class Gaming
  (10741 – 76300, n=138, last 2 years)

47619 Points +13%

Average Nvidia GeForce RTX 5070 Laptop
  (40285 – 46297, n=7)

43709 Points +4%

MSI Katana 17 HX B14WGK
Nvidia GeForce RTX 5070 Laptop

43684 Points +3%

Gigabyte Gaming A16 GA6H
Nvidia GeForce RTX 5070 Laptop

42223 Points

Lenovo LOQ 15AHP10
Nvidia GeForce RTX 5060 Laptop

41341 Points -2%

Gigabyte Aero X16 1WH
Nvidia GeForce RTX 5070 Laptop

40285 Points -5%

3DMark
1920×1080 Fire Strike Graphics
Medion Erazer Major 16 X1 MD62736
Nvidia GeForce RTX 5070 Ti Laptop

46099 Points +37%

MSI Vector 16 HX AI A2XWHG
Nvidia GeForce RTX 5070 Ti Laptop

44632 Points +32%

MSI Katana 17 HX B14WGK
Nvidia GeForce RTX 5070 Laptop

35457 Points +5%

Average Nvidia GeForce RTX 5070 Laptop
  (31345 – 37331, n=9)

34633 Points +3%

Average of class Gaming
  (2913 – 62849, n=153, last 2 years)

34515 Points +2%

Gigabyte Gaming A16 GA6H
Nvidia GeForce RTX 5070 Laptop

33771 Points

Lenovo LOQ 15AHP10
Nvidia GeForce RTX 5060 Laptop

33014 Points -2%

Gigabyte Aero X16 1WH
Nvidia GeForce RTX 5070 Laptop

31345 Points -7%

2560×1440 Time Spy Graphics
Medion Erazer Major 16 X1 MD62736
Nvidia GeForce RTX 5070 Ti Laptop

17021 Points +42%

MSI Vector 16 HX AI A2XWHG
Nvidia GeForce RTX 5070 Ti Laptop

16103 Points +35%

Average of class Gaming
  (2295 – 25763, n=149, last 2 years)

14546 Points +22%

Average Nvidia GeForce RTX 5070 Laptop
  (11969 – 14058, n=9)

13042 Points +9%

MSI Katana 17 HX B14WGK
Nvidia GeForce RTX 5070 Laptop

12556 Points +5%

Lenovo LOQ 15AHP10
Nvidia GeForce RTX 5060 Laptop

12135 Points +1%

Gigabyte Aero X16 1WH
Nvidia GeForce RTX 5070 Laptop

12119 Points +1%

Gigabyte Gaming A16 GA6H
Nvidia GeForce RTX 5070 Laptop

11969 Points

2560×1440 Port Royal Graphics
Medion Erazer Major 16 X1 MD62736
Nvidia GeForce RTX 5070 Ti Laptop

11139 Points +46%

MSI Vector 16 HX AI A2XWHG
Nvidia GeForce RTX 5070 Ti Laptop

10383 Points +37%

Average of class Gaming
  (984 – 16978, n=85, last 2 years)

10252 Points +35%

Average Nvidia GeForce RTX 5070 Laptop
  (7606 – 8843, n=8)

8364 Points +10%

MSI Katana 17 HX B14WGK
Nvidia GeForce RTX 5070 Laptop

8016 Points +5%

Gigabyte Aero X16 1WH
Nvidia GeForce RTX 5070 Laptop

7711 Points +1%

Gigabyte Gaming A16 GA6H
Nvidia GeForce RTX 5070 Laptop

7606 Points

Lenovo LOQ 15AHP10
Nvidia GeForce RTX 5060 Laptop

7422 Points -2%

3DMark 11 Performance 33991 points
3DMark Cloud Gate Standard Score 62493 points
3DMark Fire Strike Score 26381 points
3DMark Time Spy Score 11917 points

Help

Blender
v3.3 Classroom OPTIX/RTX
Lenovo LOQ 15AHP10
Nvidia GeForce RTX 5060 Laptop, AMD Ryzen 7 250

21 Seconds * -0%

Gigabyte Gaming A16 GA6H
Nvidia GeForce RTX 5070 Laptop, Intel Core i7-13620H

21 Seconds *

Gigabyte Aero X16 1WH
Nvidia GeForce RTX 5070 Laptop, AMD Ryzen AI 7 350

20.8 Seconds * +1%

MSI Katana 17 HX B14WGK
Nvidia GeForce RTX 5070 Laptop, Intel Core i7-14650HX

20 Seconds * +5%

Average of class Gaming
  (9 – 95, n=138, last 2 years)

19.5 Seconds * +7%

Average Nvidia GeForce RTX 5070 Laptop
  (17 – 21, n=7)

19.4 Seconds * +8%

MSI Vector 16 HX AI A2XWHG
Nvidia GeForce RTX 5070 Ti Laptop, Intel Core Ultra 7 255HX

16 Seconds * +24%

Medion Erazer Major 16 X1 MD62736
Nvidia GeForce RTX 5070 Ti Laptop, Intel Core Ultra 7 255HX

16 Seconds * +24%

v3.3 Classroom CUDA
Lenovo LOQ 15AHP10
Nvidia GeForce RTX 5060 Laptop, AMD Ryzen 7 250

38 Seconds * -12%

Gigabyte Aero X16 1WH
Nvidia GeForce RTX 5070 Laptop, AMD Ryzen AI 7 350

35 Seconds * -3%

Gigabyte Gaming A16 GA6H
Nvidia GeForce RTX 5070 Laptop, Intel Core i7-13620H

34 Seconds *

Average of class Gaming
  (15 – 110, n=138, last 2 years)

32.7 Seconds * +4%

Average Nvidia GeForce RTX 5070 Laptop
  (31 – 35, n=7)

32.6 Seconds * +4%

MSI Katana 17 HX B14WGK
Nvidia GeForce RTX 5070 Laptop, Intel Core i7-14650HX

32 Seconds * +6%

Medion Erazer Major 16 X1 MD62736
Nvidia GeForce RTX 5070 Ti Laptop, Intel Core Ultra 7 255HX

25 Seconds * +26%

MSI Vector 16 HX AI A2XWHG
Nvidia GeForce RTX 5070 Ti Laptop, Intel Core Ultra 7 255HX

24 Seconds * +29%

* … smaller is better

When gaming, the lead over the RTX 5060 increases slightly, but other RTX 5070 laptops, such as the MSI Katana 17, are even faster. Furthermore, the RTX 5070 is more of a graphics accelerator for Full HD displays. Although demanding or poorly optimized titles such as Indiana Jones, Stalker 2 and Oblivion Remastered run at 2,560 x 1,440 or 2,560 x 1,600 pixels and maximum details, they won’t run smoothly without the help of upscaling. However, significant performance gains are possible, especially with frame generation (clearly evident in Stalker 2).

Performance Rating – Percent
Medion Erazer Major 16 X1 MD62736 -1!
GeForce RTX 5070 Ti Laptop, Ultra 7 255HX

99.2 pt

MSI Vector 16 HX AI A2XWHG -1!
GeForce RTX 5070 Ti Laptop, Ultra 7 255HX

95.8 pt

Average of class Gaming
 

86.9 pt

Average Nvidia GeForce RTX 5070 Laptop
 

83.2 pt

MSI Katana 17 HX B14WGK -2!
GeForce RTX 5070 Laptop, i7-14650HX

82.1 pt

Gigabyte Aero X16 1WH
GeForce RTX 5070 Laptop, Ryzen AI 7 350

75.9 pt

Gigabyte Gaming A16 GA6H
GeForce RTX 5070 Laptop, i7-13620H

73.5 pt

Lenovo LOQ 15AHP10
GeForce RTX 5060 Laptop, R7 250

71.6 pt

Cyberpunk 2077 2.2 Phantom Liberty – 1920×1080 Ultra Preset (FSR off)
Medion Erazer Major 16 X1 MD62736
GeForce RTX 5070 Ti Laptop, Ultra 7 255HX

129 (105min) fps +57%

MSI Vector 16 HX AI A2XWHG
GeForce RTX 5070 Ti Laptop, Ultra 7 255HX

119.6 (98min) fps +45%

MSI Katana 17 HX B14WGK
GeForce RTX 5070 Laptop, i7-14650HX

101.5 (81min) fps +23%

Average of class Gaming
  (6.76 – 166.5, n=125, last 2 years)

99.9 fps +21%

Average Nvidia GeForce RTX 5070 Laptop
  (82.4 – 108.7, n=9)

98.2 fps +19%

Gigabyte Aero X16 1WH
GeForce RTX 5070 Laptop, Ryzen AI 7 350

90.1 (73.4min) fps +9%

Lenovo LOQ 15AHP10
GeForce RTX 5060 Laptop, R7 250

88.6 (71min) fps +8%

Gigabyte Gaming A16 GA6H
GeForce RTX 5070 Laptop, i7-13620H

82.4 (56min) fps

Baldur’s Gate 3 – 1920×1080 Ultra Preset AA:T
Medion Erazer Major 16 X1 MD62736
GeForce RTX 5070 Ti Laptop, Ultra 7 255HX

156 (61min) fps +51%

MSI Vector 16 HX AI A2XWHG
GeForce RTX 5070 Ti Laptop, Ultra 7 255HX

147.4 (71.3min, 90.9P0.1, 134.2P1) fps +42%

Average of class Gaming
  (34.5 – 246, n=89, last 2 years)

133 fps +29%

Average Nvidia GeForce RTX 5070 Laptop
  (101.3 – 135.8, n=9)

117.9 fps +14%

Gigabyte Aero X16 1WH
GeForce RTX 5070 Laptop, Ryzen AI 7 350

109.4 fps +6%

Gigabyte Gaming A16 GA6H
GeForce RTX 5070 Laptop, i7-13620H

103.5 (42min, 54.2P0.1, 81.7P1) fps

MSI Katana 17 HX B14WGK
GeForce RTX 5070 Laptop, i7-14650HX

101.3 (53.4min, 76.1P0.1, 85.7P1) fps -2%

Lenovo LOQ 15AHP10
GeForce RTX 5060 Laptop, R7 250

101 (49.2min, 62.3P0.1, 91.9P1) fps -2%

GTA V – 1920×1080 Highest Settings possible AA:4xMSAA + FX AF:16x
Medion Erazer Major 16 X1 MD62736
GeForce RTX 5070 Ti Laptop, Ultra 7 255HX

149 (2min) fps +45%

MSI Vector 16 HX AI A2XWHG
GeForce RTX 5070 Ti Laptop, Ultra 7 255HX

144.8 (3.28min, 111.1P1) fps +41%

Average Nvidia GeForce RTX 5070 Laptop
  (102.5 – 160.2, n=7)

127.2 fps +24%

Average of class Gaming
  (12.1 – 186.9, n=126, last 2 years)

121.3 fps +18%

MSI Katana 17 HX B14WGK
GeForce RTX 5070 Laptop, i7-14650HX

119 (27.4min, 83.3P1) fps +16%

Gigabyte Aero X16 1WH
GeForce RTX 5070 Laptop, Ryzen AI 7 350

111.8 (3.87min, 83.3P1) fps +9%

Lenovo LOQ 15AHP10
GeForce RTX 5060 Laptop, R7 250

108.7 (8.82min, 76.9P1) fps +6%

Gigabyte Gaming A16 GA6H
GeForce RTX 5070 Laptop, i7-13620H

102.5 (29.8min, 66.7P1) fps

Final Fantasy XV Benchmark – 1920×1080 High Quality
Medion Erazer Major 16 X1 MD62736
GeForce RTX 5070 Ti Laptop, Ultra 7 255HX

173.1 fps +80%

MSI Vector 16 HX AI A2XWHG
GeForce RTX 5070 Ti Laptop, Ultra 7 255HX

163.1 fps +70%

Average of class Gaming
  (19.2 – 215, n=141, last 2 years)

132 fps +38%

Average Nvidia GeForce RTX 5070 Laptop
  (96 – 150.6, n=6)

129.7 fps +35%

Gigabyte Aero X16 1WH
GeForce RTX 5070 Laptop, Ryzen AI 7 350

119.5 fps +24%

Lenovo LOQ 15AHP10
GeForce RTX 5060 Laptop, R7 250

118.1 fps +23%

Gigabyte Gaming A16 GA6H
GeForce RTX 5070 Laptop, i7-13620H

96 fps

Strange Brigade – 1920×1080 ultra AA:ultra AF:16
Average of class Gaming
  (38.9 – 456, n=131, last 2 years)

254 fps +25%

Average Nvidia GeForce RTX 5070 Laptop
  (203 – 258, n=4)

236 fps +16%

Gigabyte Aero X16 1WH
GeForce RTX 5070 Laptop, Ryzen AI 7 350

234 (141.3min, 180P1) fps +15%

Lenovo LOQ 15AHP10
GeForce RTX 5060 Laptop, R7 250

223 (32.5min, 170P1) fps +10%

Gigabyte Gaming A16 GA6H
GeForce RTX 5070 Laptop, i7-13620H

203 (108.3min, 150.5P1) fps

Dota 2 Reborn – 1920×1080 ultra (3/3) best looking
Medion Erazer Major 16 X1 MD62736
GeForce RTX 5070 Ti Laptop, Ultra 7 255HX

171.4 (142.6min) fps +15%

MSI Vector 16 HX AI A2XWHG
GeForce RTX 5070 Ti Laptop, Ultra 7 255HX

164.7 (140.6min) fps +11%

Average of class Gaming
  (65.1 – 248, n=144, last 2 years)

153.8 fps +3%

Average Nvidia GeForce RTX 5070 Laptop
  (130.9 – 184.2, n=7)

150.3 fps +1%

MSI Katana 17 HX B14WGK
GeForce RTX 5070 Laptop, i7-14650HX

149.3 (125.4min) fps 0%

Gigabyte Gaming A16 GA6H
GeForce RTX 5070 Laptop, i7-13620H

148.7 (124.4min) fps

Gigabyte Aero X16 1WH
GeForce RTX 5070 Laptop, Ryzen AI 7 350

131.9 (113.9min) fps -11%

Lenovo LOQ 15AHP10
GeForce RTX 5060 Laptop, R7 250

121.5 (104.6min) fps -18%

X-Plane 11.11 – 1920×1080 high (fps_test=3)
MSI Vector 16 HX AI A2XWHG
GeForce RTX 5070 Ti Laptop, Ultra 7 255HX

106.6 fps +7%

MSI Katana 17 HX B14WGK
GeForce RTX 5070 Laptop, i7-14650HX

106.4 fps +7%

Average of class Gaming
  (33.4 – 166.2, n=146, last 2 years)

104.9 fps +6%

Medion Erazer Major 16 X1 MD62736
GeForce RTX 5070 Ti Laptop, Ultra 7 255HX

101.6 fps +2%

Gigabyte Gaming A16 GA6H
GeForce RTX 5070 Laptop, i7-13620H

99.4 fps

Average Nvidia GeForce RTX 5070 Laptop
  (73.9 – 115.9, n=7)

95.7 fps -4%

Gigabyte Aero X16 1WH
GeForce RTX 5070 Laptop, Ryzen AI 7 350

83.7 fps -16%

Lenovo LOQ 15AHP10
GeForce RTX 5060 Laptop, R7 250

72.1 fps -27%

Performance Rating – Percent
Medion Erazer Major 16 X1 MD62736
GeForce RTX 5070 Ti Laptop, Ultra 7 255HX

100 pt

MSI Vector 16 HX AI A2XWHG
GeForce RTX 5070 Ti Laptop, Ultra 7 255HX

94.6 pt

Average of class Gaming
 

92.5 pt

MSI Katana 17 HX B14WGK
GeForce RTX 5070 Laptop, i7-14650HX

72.2 pt

Average Nvidia GeForce RTX 5070 Laptop
 

71.4 pt

Gigabyte Gaming A16 GA6H
GeForce RTX 5070 Laptop, i7-13620H

67 pt

Lenovo LOQ 15AHP10
GeForce RTX 5060 Laptop, R7 250

61 pt

Stalker 2
2560×1440 Epic Preset
Medion Erazer Major 16 X1 MD62736
GeForce RTX 5070 Ti Laptop, Ultra 7 255HX

49.9 (35.4min, 37.2P0.1, 42.6P1) fps +46%

MSI Vector 16 HX AI A2XWHG
GeForce RTX 5070 Ti Laptop, Ultra 7 255HX

46.9 (8.64min, 20.8P0.1, 39.5P1) fps +37%

Average of class Gaming
  (31.7 – 65.4, n=9, last 2 years)

46 fps +35%

MSI Katana 17 HX B14WGK
GeForce RTX 5070 Laptop, i7-14650HX

36 (25.9min, 26.4P0.1, 29P1) fps +5%

Average Nvidia GeForce RTX 5070 Laptop
  (34.2 – 36, n=2)

35.1 fps +3%

Gigabyte Gaming A16 GA6H
GeForce RTX 5070 Laptop, i7-13620H

34.2 (5.12min, 9.3P0.1, 27.5P1) fps

Lenovo LOQ 15AHP10
GeForce RTX 5060 Laptop, R7 250

31.8 (16.1min, 16.3P0.1, 24.4P1) fps -7%

2560×1440 Epic Preset + Quality DLSS + FG
Medion Erazer Major 16 X1 MD62736
GeForce RTX 5070 Ti Laptop, Ultra 7 255HX

104.6 (23min, 47P0.1, 58.2P1) fps +56%

MSI Vector 16 HX AI A2XWHG
GeForce RTX 5070 Ti Laptop, Ultra 7 255HX

100.8 (39.4min, 45.6P0.1, 57P1) fps +51%

Average of class Gaming
  (58.3 – 134.6, n=9, last 2 years)

94.3 fps +41%

MSI Katana 17 HX B14WGK
GeForce RTX 5070 Laptop, i7-14650HX

74.1 (27.4min, 35.8P0.1, 43.8P1) fps +11%

Average Nvidia GeForce RTX 5070 Laptop
  (66.9 – 74.1, n=2)

70.5 fps +5%

Gigabyte Gaming A16 GA6H
GeForce RTX 5070 Laptop, i7-13620H

66.9 (32min, 35.3P0.1, 39.7P1) fps

Lenovo LOQ 15AHP10
GeForce RTX 5060 Laptop, R7 250

62.8 (2.98min, 8.83P0.1, 30.3P1) fps -6%

Doom: The Dark Ages
2560×1440 Ultra Nightmare AA:T
Medion Erazer Major 16 X1 MD62736
GeForce RTX 5070 Ti Laptop, Ultra 7 255HX

59.1 (44.9min, 45.6P0.1, 46.4P1) fps +50%

MSI Vector 16 HX AI A2XWHG
GeForce RTX 5070 Ti Laptop, Ultra 7 255HX

57.9 (39.3min, 43.7P0.1, 46.1P1) fps +47%

Average of class Gaming
  (35 – 82.1, n=13, last 2 years)

56 fps +42%

MSI Katana 17 HX B14WGK
GeForce RTX 5070 Laptop, i7-14650HX

45.4 (32.9min, 33.5P0.1, 35P1) fps +15%

Average Nvidia GeForce RTX 5070 Laptop
  (39.5 – 45.4, n=3)

43.2 fps +9%

Gigabyte Gaming A16 GA6H
GeForce RTX 5070 Laptop, i7-13620H

39.5 (29.1min, 29.4P0.1, 30.2P1) fps

Lenovo LOQ 15AHP10
GeForce RTX 5060 Laptop, R7 250

35 (27.6min, 29P0.1, 30.1P1) fps -11%

2560×1440 Ultra Nightmare – DLSS Quality
Medion Erazer Major 16 X1 MD62736
GeForce RTX 5070 Ti Laptop, Ultra 7 255HX

82.5 (47.8min, 62.4P0.1, 68.1P1) fps +51%

MSI Vector 16 HX AI A2XWHG
GeForce RTX 5070 Ti Laptop, Ultra 7 255HX

79.1 (55.3min, 58.1P0.1, 64.6P1) fps +45%

Average of class Gaming
  (54.6 – 107.3, n=12, last 2 years)

78.3 fps +43%

Average Nvidia GeForce RTX 5070 Laptop
  (54.6 – 66.1, n=3)

60.2 fps +10%

MSI Katana 17 HX B14WGK
GeForce RTX 5070 Laptop, i7-14650HX

59.9 (48.8min, 48.9P0.1, 51.1P1) fps +10%

Lenovo LOQ 15AHP10
GeForce RTX 5060 Laptop, R7 250

55.1 (43min, 43.2P0.1, 43.7P1) fps +1%

Gigabyte Gaming A16 GA6H
GeForce RTX 5070 Laptop, i7-13620H

54.6 (42min, 42.5P0.1, 43.9P1) fps

The Elder Scrolls IV Oblivion Remastered
2560×1440 Ultra Preset AA:T
Medion Erazer Major 16 X1 MD62736
GeForce RTX 5070 Ti Laptop, Ultra 7 255HX

30.1 (19.8min, 20.5P0.1, 24.6P1) fps +49%

MSI Vector 16 HX AI A2XWHG
GeForce RTX 5070 Ti Laptop, Ultra 7 255HX

28 (8.9min, 10.9P0.1, 21.3P1) fps +39%

Average of class Gaming
  (12.7 – 41.7, n=8, last 2 years)

26.2 fps +30%

MSI Katana 17 HX B14WGK
GeForce RTX 5070 Laptop, i7-14650HX

20.9 (7.7min, 8.12P0.1, 13P1) fps +3%

Gigabyte Gaming A16 GA6H
GeForce RTX 5070 Laptop, i7-13620H

20.2 (4.84min, 6.04P0.1, 14.9P1) fps

Average Nvidia GeForce RTX 5070 Laptop
  (19.5 – 20.9, n=3)

20.2 fps 0%

Lenovo LOQ 15AHP10
GeForce RTX 5060 Laptop, R7 250

12.7 (5.3min, 5.39P0.1, 6.75P1) fps -37%

2560×1440 Ultra Preset + Quality DLSS
Medion Erazer Major 16 X1 MD62736
GeForce RTX 5070 Ti Laptop, Ultra 7 255HX

44.7 (15.3min, 18.9P0.1, 36P1) fps +48%

MSI Vector 16 HX AI A2XWHG
GeForce RTX 5070 Ti Laptop, Ultra 7 255HX

41.9 (5.72min, 10.2P0.1, 26.1P1) fps +38%

Average of class Gaming
  (25.3 – 59.7, n=8, last 2 years)

40.1 fps +32%

Average Nvidia GeForce RTX 5070 Laptop
  (30.3 – 34, n=3)

32.1 fps +6%

MSI Katana 17 HX B14WGK
GeForce RTX 5070 Laptop, i7-14650HX

32 (10.6min, 11.7P0.1, 18.5P1) fps +6%

Gigabyte Gaming A16 GA6H
GeForce RTX 5070 Laptop, i7-13620H

30.3 (3.34min, 5.34P0.1, 21.2P1) fps

Lenovo LOQ 15AHP10
GeForce RTX 5060 Laptop, R7 250

25.3 (1.461min, 2.2P0.1, 11.2P1) fps -17%

Kingdom Come Deliverance 2
2560×1440 Ultra Preset
Medion Erazer Major 16 X1 MD62736
GeForce RTX 5070 Ti Laptop, Ultra 7 255HX

62.7 (52.5min, 52.8P0.1, 54.1P1) fps +47%

Average of class Gaming
  (42.6 – 86, n=9, last 2 years)

61.2 fps +44%

MSI Vector 16 HX AI A2XWHG
GeForce RTX 5070 Ti Laptop, Ultra 7 255HX

59 (46.5min, 49.2P0.1, 50.6P1) fps +38%

Average Nvidia GeForce RTX 5070 Laptop
  (42.6 – 52.1, n=3)

46.7 fps +10%

Lenovo LOQ 15AHP10
GeForce RTX 5060 Laptop, R7 250

45.6 (37.7min, 38.3P0.1, 39.2P1) fps +7%

MSI Katana 17 HX B14WGK
GeForce RTX 5070 Laptop, i7-14650HX

45.5 (37.2min, 38.1P0.1, 38.9P1) fps +7%

Gigabyte Gaming A16 GA6H
GeForce RTX 5070 Laptop, i7-13620H

42.6 (35min, 35.5P0.1, 36.4P1) fps

2560×1440 Ultra Preset + Quality DLSS
Medion Erazer Major 16 X1 MD62736
GeForce RTX 5070 Ti Laptop, Ultra 7 255HX

86.1 (68.9min, 69.8P0.1, 71.8P1) fps +47%

Average of class Gaming
  (57.6 – 114.5, n=9, last 2 years)

80.7 fps +38%

MSI Vector 16 HX AI A2XWHG
GeForce RTX 5070 Ti Laptop, Ultra 7 255HX

79.2 (50.6min, 54.7P0.1, 66.4P1) fps +35%

Average Nvidia GeForce RTX 5070 Laptop
  (58.5 – 71.5, n=3)

63.8 fps +9%

MSI Katana 17 HX B14WGK
GeForce RTX 5070 Laptop, i7-14650HX

61.5 (45.4min, 50.2P0.1, 51.5P1) fps +5%

Gigabyte Gaming A16 GA6H
GeForce RTX 5070 Laptop, i7-13620H

58.5 (43.4min, 46.3P0.1, 49.3P1) fps

Lenovo LOQ 15AHP10
GeForce RTX 5060 Laptop, R7 250

57.6 (29.8min, 29.9P0.1, 30P1) fps -2%

There were no abnormalities in the 30-minute Cyberpunk 2077 test, and the frame rate remained fairly stable throughout the entire period

0102030405060708090100110Tooltip

When running idle, the Gaming A16 remained pleasantly quiet. At 25 to 27 dB(A), it’s quieter than most competitors. However, when using Game Mode, the fans revved up considerably under load, reaching a very audible 54 to 55 dB(A) – noise level that suggests you might be better off using headphones.

Noise Level

Idle

25 / 26 / 27 dB(A)

Load 54 / 55 dB(A)
  red to green bar
 

30 dB
silent

40 dB(A)
audible

50 dB(A)
loud


min: dark, med: mid, max: light   Earthworks M23R, Arta (15 cm distance)   environment noise: 24 dB(A)

dB(A) 0102030405060708090Deep BassMiddle BassHigh BassLower RangeMidsHigher MidsLower HighsMid HighsUpper HighsSuper Highs2038.836.738.736.1412534.83432.334.538.43143.740.443.137.439.84028.127.727.42326.35024.523.324.421.225.36322.618.921.819.523.78023.515.315.514.822.210024.31514.915.324.512524.114.415.514.323.516026.615.616.816.327.420028.120.120.51931.12502916.517.31731.231531.213.814.911.932.340033.513.613.311.134.450036.113.113.711.436.463036.612.512.710.836.980038.212.812.110.938.5100039.112.512.510.939.5125041.812.412.410.942.2160042.813.112.311.343200042.512.712.311.743.1250042.313.212.612.242.6315043.31413.112.743.9400043.31512.812.843.8500045.516.213.41345.9630043.71513.513.144.6800039.814.813.413.640.91000038.114.313.413.339.11250035.614.213.513.436.81600029.215.413.112.830SPL5426.125.224.554.6N9.10.70.70.69.5median 38.1median 14.2median 13.4median 12.8median 38.5Delta6.811.31.65.9hearing rangehide median Fan Noise
Gigabyte Gaming A16 GA6H
i7-13620H, GeForce RTX 5070 Laptop
Gigabyte Aero X16 1WH
Ryzen AI 7 350, GeForce RTX 5070 Laptop
MSI Katana 17 HX B14WGK
i7-14650HX, GeForce RTX 5070 Laptop
MSI Vector 16 HX AI A2XWHG
Ultra 7 255HX, GeForce RTX 5070 Ti Laptop
Medion Erazer Major 16 X1 MD62736
Ultra 7 255HX, GeForce RTX 5070 Ti Laptop
Lenovo LOQ 15AHP10
R7 250, GeForce RTX 5060 Laptop
Noise

11%

-12%

-10%

-3%

-31%

off / environment *

24

23.9

-0%

25

-4%

25

-4%

25

-4%

25

-4%

Idle Minimum *

25

23.9

4%

31

-24%

33

-32%

26

-4%

43

-72%

Idle Average *

26

23.9

8%

32

-23%

34

-31%

27

-4%

45

-73%

Idle Maximum *

27

23.9

11%

34

-26%

38

-41%

30

-11%

48

-78%

Load Average *

54

33.2

39%

50

7%

46

15%

53

2%

53

2%

Cyberpunk 2077 ultra *

54

50.2

7%

58

-7%

47

13%

54

-0%

51

6%

Load Maximum *

55

50.2

9%

59

-7%

49

11%

54

2%

53

4%

* … smaller is better

Let’s move on to the temperatures, which are largely based on other gaming models. While we measured up to 50°C on the top and up to 49°C on the bottom of the case during 3D operation, the chassis comfortably sat at around 31°C when idling.

  50 °C
122 F
49 °C
120 F
49 °C
120 F
 
  44 °C
111 F
45 °C
113 F
44 °C
111 F
 
  35 °C
95 F
34 °C
93 F
32 °C
90 F
 
Maximum: 50 °C = 122 F
Average: 42.4 °C = 108 F
48 °C
118 F
45 °C
113 F
48 °C
118 F
49 °C
120 F
45 °C
113 F
44 °C
111 F
35 °C
95 F
36 °C
97 F
30 °C
86 F
Maximum: 49 °C = 120 F
Average: 42.2 °C = 108 F

Power Supply (max.)  48 °C = 118 F | Room Temperature 21 °C = 70 F | Fluke t3000FC (calibrated), Voltcraft IR-900

(-) The average temperature for the upper side under maximal load is 42.4 °C / 108 F, compared to the average of 33.9 °C / 93 F for the devices in the class Gaming.
(-) The maximum temperature on the upper side is 50 °C / 122 F, compared to the average of 40.5 °C / 105 F, ranging from 21.2 to 68.8 °C for the class Gaming.
(-) The bottom heats up to a maximum of 49 °C / 120 F, compared to the average of 43.3 °C / 110 F
(+) In idle usage, the average temperature for the upper side is 31.2 °C / 88 F, compared to the device average of 33.9 °C / 93 F.
(-) 3: The average temperature for the upper side is 42.2 °C / 108 F, compared to the average of 33.9 °C / 93 F for the class Gaming.
(+) The palmrests and touchpad are reaching skin temperature as a maximum (35 °C / 95 F) and are therefore not hot.
(-) The average temperature of the palmrest area of similar devices was 28.9 °C / 84 F (-6.1 °C / -11 F).

Our stress test using the Furmark and Prime95 tools resulted in a CPU temperature of around 74°C and a GPU temperature of around 78°C, both of which are still moderate values.

The sound quality of the 16-inch device is surprisingly good when compared to the competition. For example, the Gigabyte model performed better than the MSI Vector 16, although the latter is somewhat lacking in the bass department.

dB(A) 0102030405060708090Deep BassMiddle BassHigh BassLower RangeMidsHigher MidsLower HighsMid HighsUpper HighsSuper Highs2037.739.92532.337.13144.347.34028.431.15038.939.36322.428.18016.426.410015.333.212513.844.716015.948.820021.15725017.463.931513.764.340013.267.85001371.563012.374.68001271.3100011.667125011.568.2160011.369.6200011.670.7250012.363.9315012.964.1400012.861.350001365.2630013.269.2800013.170.3100001365.51250012.759.21600011.959.7SPL24.980.6N0.652median 13median 65.2Delta0.8635.246.131.337.142.447.82630.62430.818.733.416.535.614.441.914.550.217.854.72056.716.759.513.262.8127111.67811.181.210.377.811.178.61177.711.475.712.271.812.871.913.167.913.567.313.465.813.465.913.466.613.162.512.754.812.152.924.886.30.666median 13.1median 66.61.48.7hearing rangehide median Pink Noise

Idle power consumption is unspectacular, in a positive way. It ranges from 9 to 23 watts, and under load, increases to 91 to 155 watts. This proves to many competitors just how economical a gaming laptop can be. However, it’s worth noting that when connected to an external monitor, the dGPU is always active.

Gigabyte Gaming A16 GA6H
i7-13620H, GeForce RTX 5070 Laptop
Gigabyte Aero X16 1WH
Ryzen AI 7 350, GeForce RTX 5070 Laptop
MSI Katana 17 HX B14WGK
i7-14650HX, GeForce RTX 5070 Laptop
MSI Vector 16 HX AI A2XWHG
Ultra 7 255HX, GeForce RTX 5070 Ti Laptop
Medion Erazer Major 16 X1 MD62736
Ultra 7 255HX, GeForce RTX 5070 Ti Laptop
Lenovo LOQ 15AHP10
R7 250, GeForce RTX 5060 Laptop
Average of class Gaming
 
Power Consumption

15%

-34%

-49%

-65%

-33%

-49%

Idle Minimum *

9

5.8

36%

9.7

-8%

7.1

21%

17.8

-98%

20

-122%

Idle Average *

11

10.9

1%

15

-36%

15.9

-45%

20.7

-88%

20.7

-88%

Idle Maximum *

23

11.2

51%

23.7

-3%

29.5

-28%

23.4

-2%

22.7

1%

Load Average *

91

91.3

-0%

126

-38%

124

-36%

110

-21%

71

22%

Cyberpunk 2077 ultra *

132.5

123.8

7%

205

-55%

222

-68%

233

-76%

153.1

-16%

Cyberpunk 2077 ultra external monitor *

130

117.9

9%

202

-55%

217

-67%

232

-78%

151.1

-16%

Load Maximum *

155

155.3

-0%

227

-46%

336

-117%

297

-92%

172

-11%

* … smaller is better

0102030405060708090100110120130Tooltip

Accordingly, the battery life is also above average. Apart from the Aero X16, the competitors can’t match (almost) 7.5 hours in the Wi-Fi test (brightness reduced to 150 cd/m²), even though Gigabyte doesn’t even have the largest battery (76 Wh).

Gigabyte Gaming A16 GA6H
i7-13620H, GeForce RTX 5070 Laptop, 76 Wh
Gigabyte Aero X16 1WH
Ryzen AI 7 350, GeForce RTX 5070 Laptop, 76 Wh
MSI Katana 17 HX B14WGK
i7-14650HX, GeForce RTX 5070 Laptop, 75 Wh
MSI Vector 16 HX AI A2XWHG
Ultra 7 255HX, GeForce RTX 5070 Ti Laptop, 90 Wh
Medion Erazer Major 16 X1 MD62736
Ultra 7 255HX, GeForce RTX 5070 Ti Laptop, 80 Wh
Lenovo LOQ 15AHP10
R7 250, GeForce RTX 5060 Laptop, 60 Wh
Average of class Gaming
 
Battery Runtime

11%

-34%

-9%

-18%

-42%

-16%

WiFi v1.3

462

515

11%

305

-34%

419

-9%

380

-18%

270

-42%

Reader / Idle

414

Load

75

The Gaming A16 from Gigabyte is a successful 16-inch model that offers few unique selling points, without possessing any major weaknesses.

Gigabyte Gaming A16 GA6H – 07/22/2025 v8
Florian Glaser

Connectivity

56 / 80 → 70%

Application Performance

84%

Gaming – Weighted Average

CO2 Emissions
No Data

Materials
0%

Packaging
50%

Power Use
76.2%

Repairability
50%

Software Updates
22.3%

Recycle Logo Total Sustainability Score: 33.1%

Image

Model / Review

Price

Weight

Height

Display

1.

80.1%

Gigabyte Gaming A16 GA6H

Gigabyte Gaming A16 GA6H
Intel Core i7-13620H ⎘
Nvidia GeForce RTX 5070 Laptop ⎘
16 GB Memory, 1024 GB SSD
Amazon:
1. $1,249.99
GIGABYTE – Gaming A16 Gaming…
2. $1,099.99
GIGABYTE – Gaming A16 Gaming…
3. $15.99
Vaxson 2-Pack Film Protector…
List Price: 1700 EUR
2.3 kg 23 mm 16.00″
2560×1600
189 PPI
IPS

2.

83.7%

Gigabyte Aero X16 1WH

Gigabyte Aero X16 1WH
AMD Ryzen AI 7 350 ⎘
Nvidia GeForce RTX 5070 Laptop ⎘
32 GB Memory, 1024 GB SSD
Amazon:
1. $1,449.99
GIGABYTE – AERO X16 – Copilo…
2. $1,299.99
GIGABYTE – AERO X16-165Hz 25…
3. $15.99
Vaxson 2-Pack Film Protector…
List Price: 1799€
2 kg 19.9 mm 16.00″
2560×1600
189 PPI
IPS

3.

77.3%

MSI Katana 17 HX B14WGK

MSI Katana 17 HX B14WGK
Intel Core i7-14650HX ⎘
Nvidia GeForce RTX 5070 Laptop ⎘
16 GB Memory, 1024 GB SSD
Amazon:
1. $49.99
GVKRLXZ 230W 200W AC Adapter…
List Price: 1800 EUR
2.7 kg 28 mm 17.30″
2560×1440
170 PPI
IPS

4.

84%

MSI Vector 16 HX AI A2XWHG

MSI Vector 16 HX AI A2XWHG
Intel Core Ultra 7 255HX ⎘
Nvidia GeForce RTX 5070 Ti Laptop ⎘
16 GB Memory, 512 GB SSD
Amazon:
1. $2,489.00
HIDevolution [2025] MSI Vect…
2. $2,524.00
HIDevolution [2025] MSI Vect…
3. $2,199.00
EXCaliberPC [2025] MSI Vecto…
List Price: 2000 EUR
2.6 kg 28.6 mm 16.00″
2560×1600
189 PPI
IPS

5.

85.2%

Medion Erazer Major 16 X1 MD62736

Medion Erazer Major 16 X1 MD62736
Intel Core Ultra 7 255HX ⎘
Nvidia GeForce RTX 5070 Ti Laptop ⎘
32 GB Memory,  SSD
List Price: 2600 EUR 2.5 kg 22.7 mm 16.00″
2560×1600
189 PPI
IPS

6.

77.5%

Lenovo LOQ 15AHP10

Lenovo LOQ 15AHP10
AMD Ryzen 7 250 ⎘
Nvidia GeForce RTX 5060 Laptop ⎘
16 GB Memory, 1024 GB SSD
Amazon:
1. $120.99
20V 12.25A 245W Slim Tip Cha…
2. $75.99
Hodeay 300W Laptop Charger C…
3. $899.00
Lenovo LOQ 15AHP9
2.4 kg 24 mm 15.60″
1920×1080
141 PPI
IPS

Related Articles

Transparency

The selection of devices to be reviewed is made by our editorial team. The test sample was provided to the author as a loan by the manufacturer or retailer for the purpose of this review. The lender had no influence on this review, nor did the manufacturer receive a copy of this review before publication. There was no obligation to publish this review. We never accept compensation or payment in return for our reviews. As an independent media company, Notebookcheck is not subjected to the authority of manufacturers, retailers or publishers.

This is how Notebookcheck is testing

Every year, Notebookcheck independently reviews hundreds of laptops and smartphones using standardized procedures to ensure that all results are comparable. We have continuously developed our test methods for around 20 years and set industry standards in the process. In our test labs, high-quality measuring equipment is utilized by experienced technicians and editors. These tests involve a multi-stage validation process. Our complex rating system is based on hundreds of well-founded measurements and benchmarks, which maintains objectivity. Further information on our test methods can be found here.

Florian Glaser, 2025-07-30 (Update: 2025-07-30)

RELATED ARTICLES

LEAVE A REPLY

Please enter your comment!
Please enter your name here

This site uses Akismet to reduce spam. Learn how your comment data is processed.

Most Popular

Recent Comments