Gaming
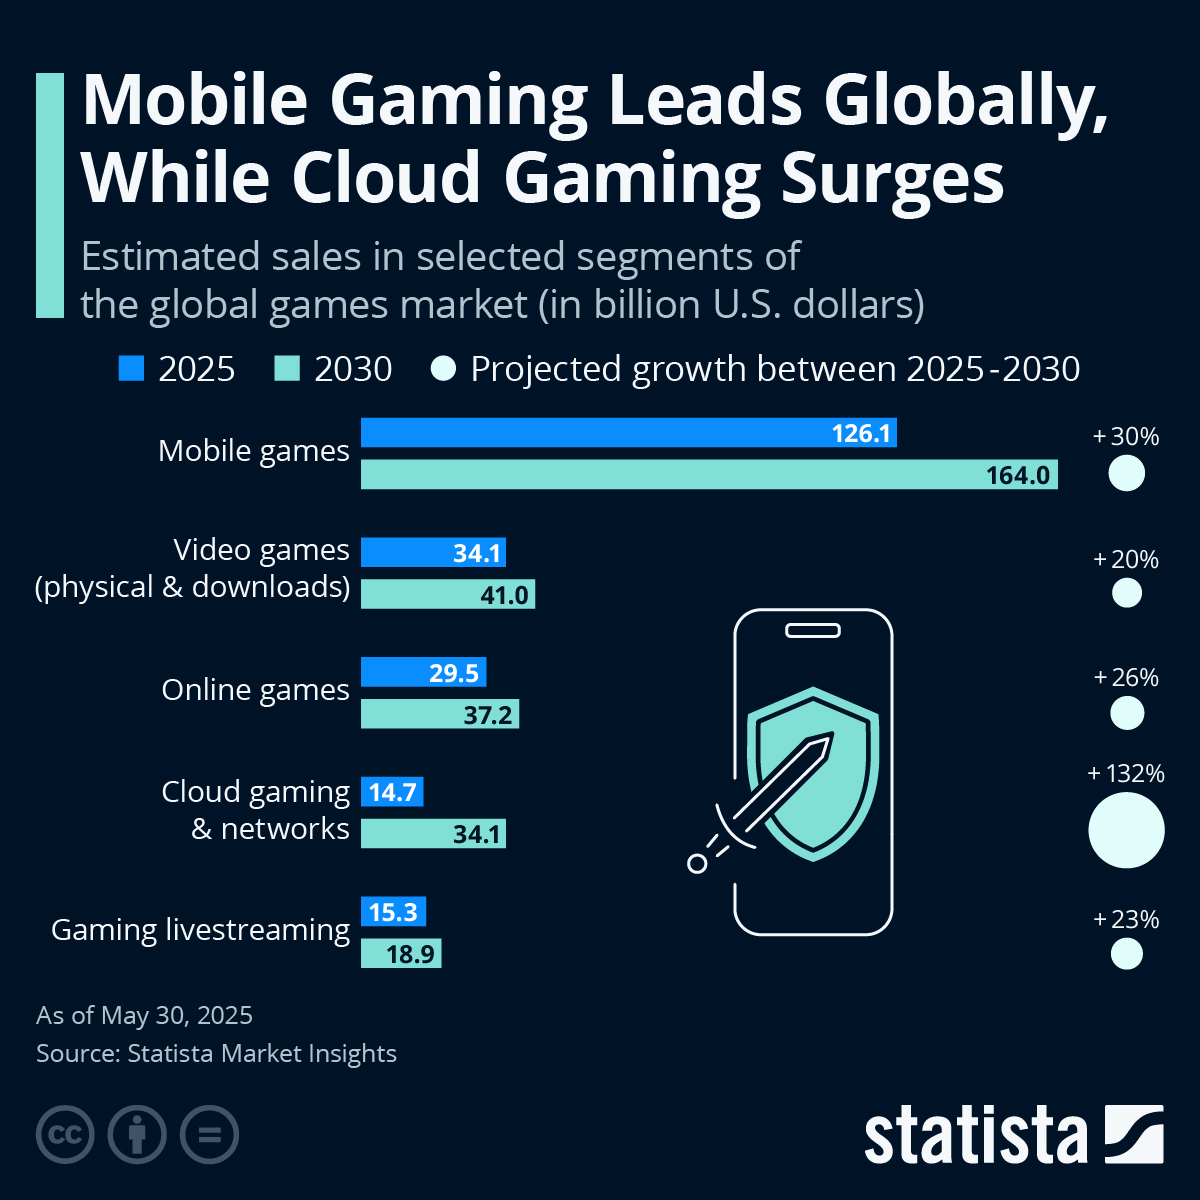
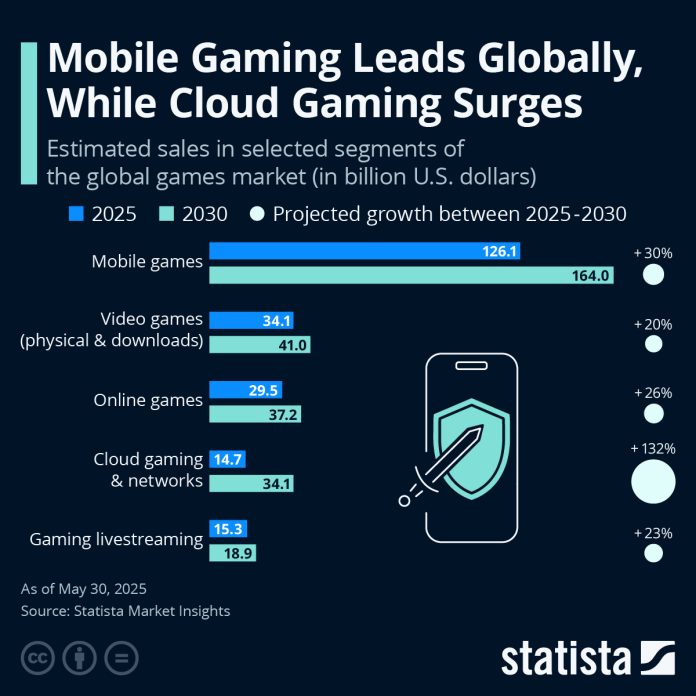
Mobile gaming is set to dominate the gaming market in 2025 and is expected to maintain its lead in the coming years. According to Statista Market Insights, the subsector’s global revenue is projected to reach $126 billion in 2025 and to surpass $160 billion by 2030 – an increase of 30 percent. This surge is largely driven by the widespread accessibility and affordability of smartphones and tablets, with mobile gaming particularly popular in Asia and the Pacific.
The mobile gaming segment is far ahead of the next biggest group: Video games. As the following chart shows, physical and downloadable games (such as from Steam) are projected to have a joint revenue of $34 billion in 2025, rising to $41 billion in 2030. Physical games make up the smaller and diminishing share of this, at just $11.3 billion in 2025 (33 percent of the combined video games segment) and $11.6 billion by 2030 (28 percent).
While cloud gaming is a smaller segment overall, it stands out compared to the other segments in terms of growth. Combined with networks (systems that allow multiple players to interact online), its revenue is expected to more than double over the next five years. The technology allows players to stream high-quality games without having to buy expensive hardware. This growth is being fuelled by recent investments from companies such as Google and Amazon into data centers and cloud infrastructure.
Gaming hardware and in-game advertising are also huge money-makers. Worldwide, gaming hardware is expected to have a revenue of $178 billion in 2025, while in-game advertising is expected to reach $125 billion this year.

Description
This chart shows the estimated sales in selected segments of the global games market (in billion U.S. dollars).
Related Infographics
FAQ
-
The Statista “Chart of the Day”, made available under the Creative Commons License CC BY-ND 3.0, may be used and displayed without charge by all commercial and non-commercial websites. Use is, however, only permitted with proper attribution to Statista. When publishing one of these graphics, please include a backlink to the respective infographic URL. More Information
-
The Statista “Chart of the Day” currently focuses on two sectors: “Media and Technology”, updated daily and featuring the latest statistics from the media, internet, telecommunications and consumer electronics industries; and “Economy and Society”, which current data from the United States and around the world relating to economic and political issues as well as sports and entertainment.
-
For individual content and infographics in your Corporate Design, please visit our agency website www.statista.design
Any more questions?
Get in touch with us quickly and easily.
We are happy to help!

Statista Content & Design
Need infographics, animated videos, presentations, data research or social media charts?
