")
Reports of the week:
-
Singular: Trends in Mobile Game Marketing in Q2’25
-
Games & Numbers (July 2 – July 15, 2025)
-
GameDiscoverCo: Steam Revenue Distribution by Genre

Data is based on trillions of ad impressions, tens of billions of clicks, billions of installs, and user spending. This report covers the overall mobile market, but I will only cover figures relevant to the gaming sector.
-
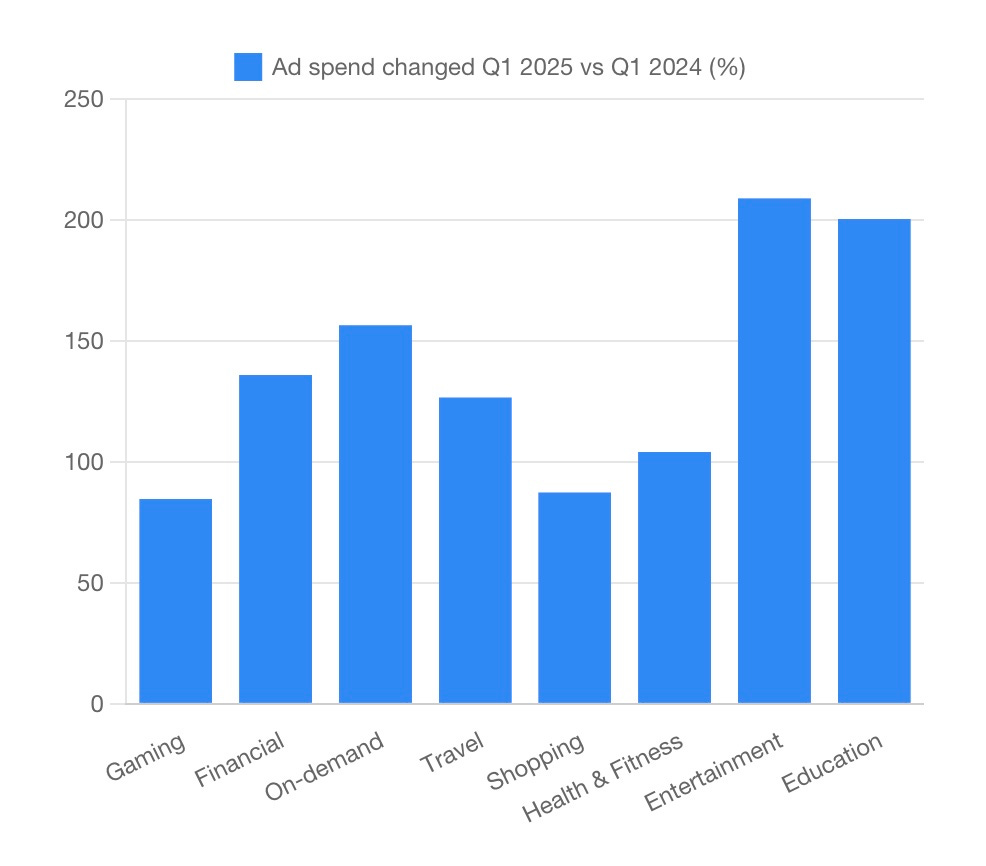
Singular reports that user spending on mobile marketing grew by 40.3% YoY.

-
Growing segments are entertainment, finance, travel, and education apps. Marketing spend is declining in shopping, health, fitness, and games.
-
In Q1’25, marketing spend for games dropped by approximately 15% YoY.

-
According to Singular, 89.5% of all game installs are on Android devices. However, iOS devices account for 89.6% of total revenue.
-
Puzzle, simulation, and action games are the leaders in downloads on Android, accounting for 76% of all installs.

-
Top growth by downloads genres: match games (+171% YoY); puzzles (+150% YoY); action (+140% YoY); sports (+135% YoY); kids’ games (+132% YoY).
Consider subscribing to the GameDev Reports Premium tier to support the newsletter. Get access to the list of curated articles & archive of Gaming Reports that I’ve been collecting since 2020.
-
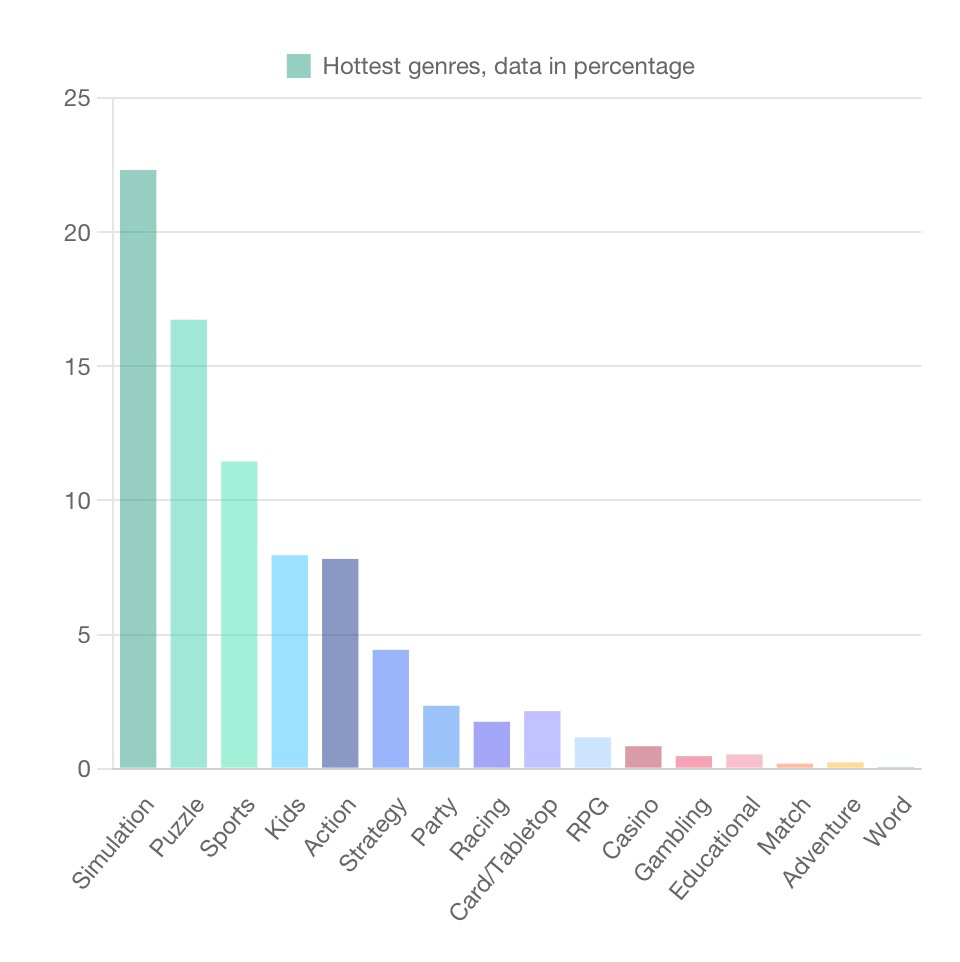
Simulation, puzzle, and sports games are the leaders in downloads on iOS, making up 63% of all downloads.
-
Fastest-growing genres by iOS downloads in Q1’25: action (+218% YoY), educational (+210% YoY), card/board (+177% YoY), simulation (+154% YoY), gambling (+136% YoY).
-
Games have one of the highest ATT opt-in rates on iOS at 26.5%.

-
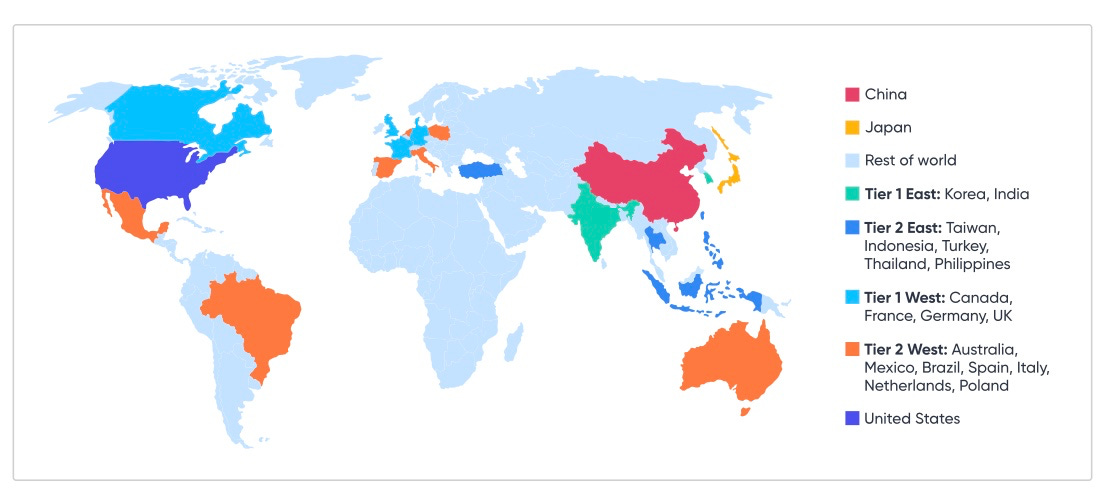
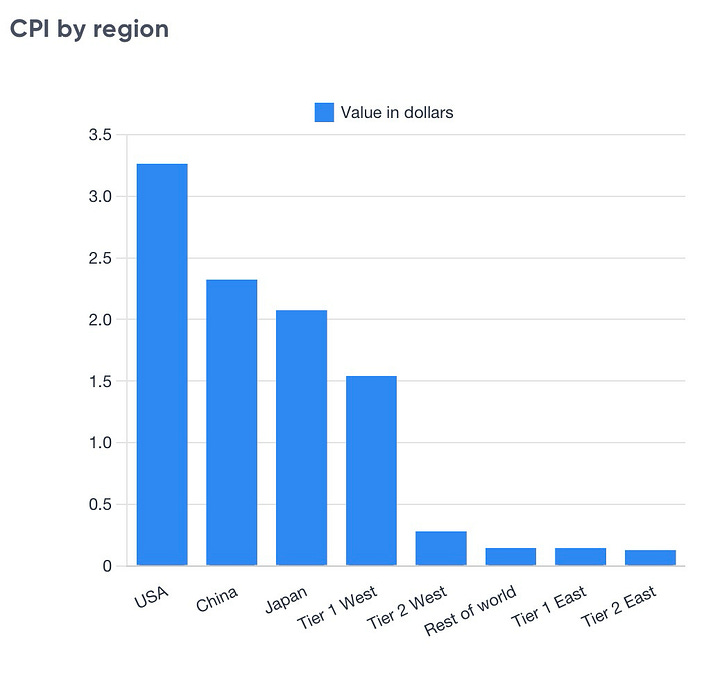
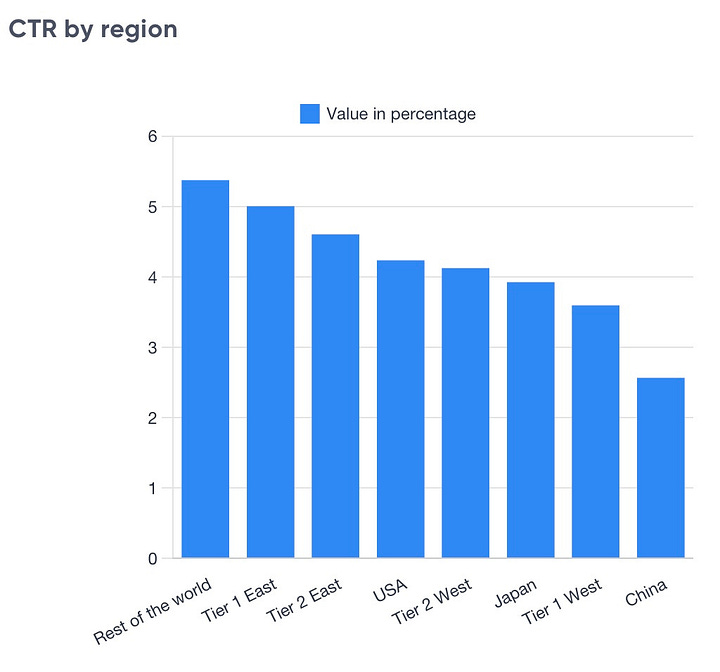
On Android, the highest CPI is in the US ($3.25), China ($2.3), and Japan ($2.05). China has the lowest CTR, while Tier-3 markets have the highest.
-
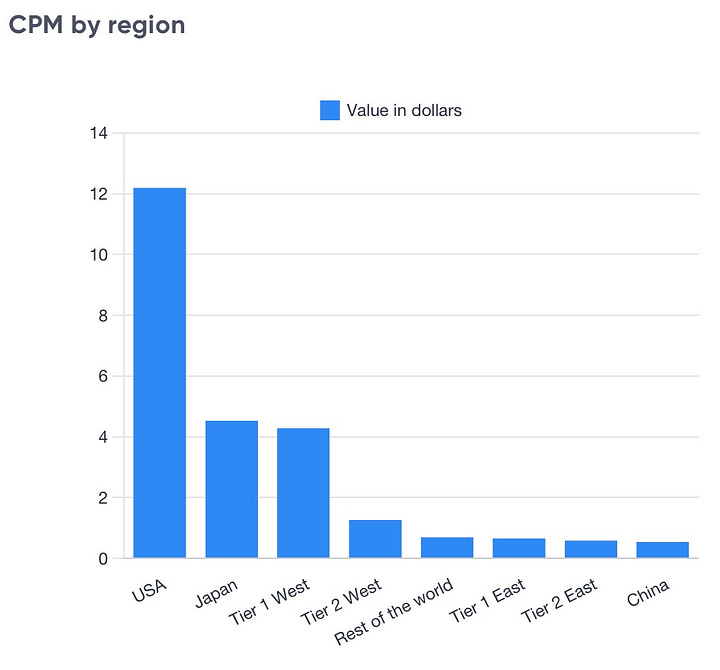
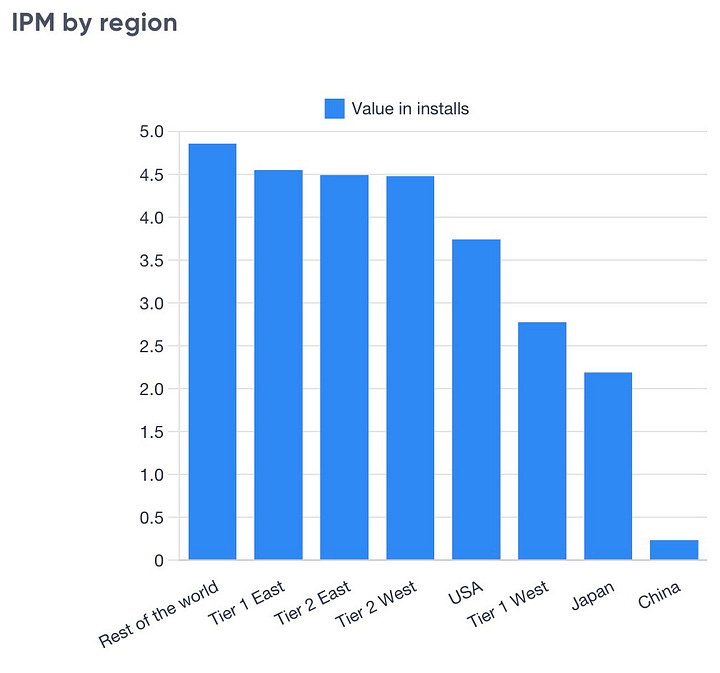
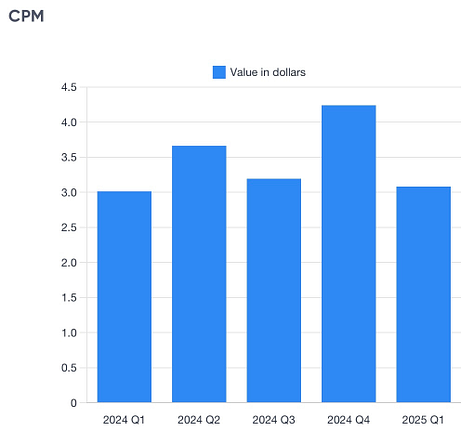
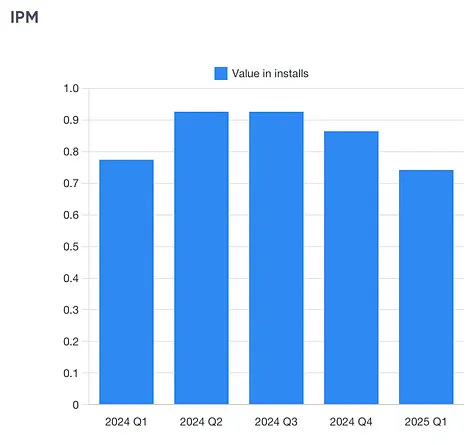
The US has by far the highest CPM. The average IPM by country is 3–5 installs, with China showing a significant statistical drop (IPM much lower).
-
On iOS, RPG is the most expensive genre (CPI – $36.5), followed by casino ($16.69).

❗️Since Singular uses SKAN data for this report, there is no regional breakdown.
-
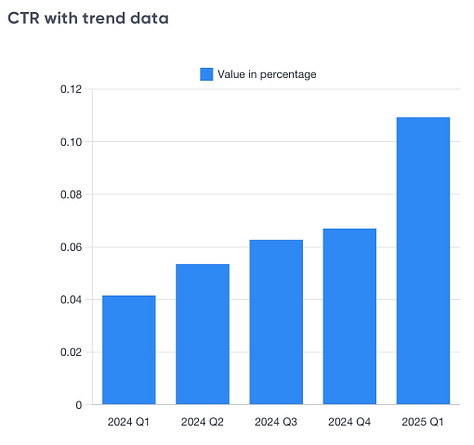
CTR on iOS grew by 250% in Q1’25. CPM increased slightly by 2%, but is 27% lower than the previous quarter. IPM dropped by 4% YoY.
-
Google, Meta, AppLovin, Apple Ads, and TikTok are the five most popular ad networks for games.

-
Lords of the Fallen has reached 5.5 million players. This includes players who got the game through subscriptions.
-
Indie hit Peak has sold 4.5 million copies, with the US, Russia, and the UK being the top markets.
-
Sultan’s Game from the Chinese studio Double Cross hit 1 million copies sold.
Consider subscribing to the GameDev Reports Premium tier to support the newsletter. Get access to the list of curated articles & archive of Gaming Reports that I’ve been collecting since 2020.
-
Death Stranding 2: On the Beach sold over 674,000 copies in its first 3 days, according to Video Game Insights. As of now, the platform reports over 1 million sold. Official sales figures have yet to be announced.
-
The Alters by Polish studio 11 bit studios sold 280,000 copies in just under a month.
-
Mafia: The Old Country has accumulated over 2.5 million wishlists across all platforms. The game releases on August 8.
-
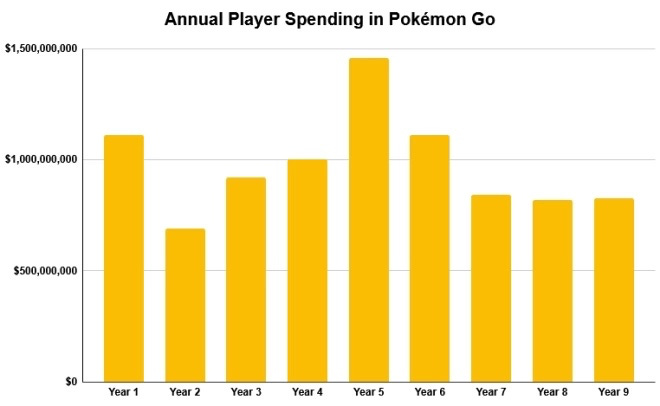
Over 9 years of operations, Pokémon GO has earned more than $8.8 billion (AppMagic data). The real figure is likely higher, since the project is available on alternative platforms and has a web shop.
-
Whiteout Survival surpassed $3 billion in gross revenue in less than 2.5 years (AppMagic). The game showed impressive growth: in its first full month, March 2023, it earned $9.9 million; in March 2024, $91.3 million; in March 2025, $205.9 million. The game has now reached a revenue plateau.

-
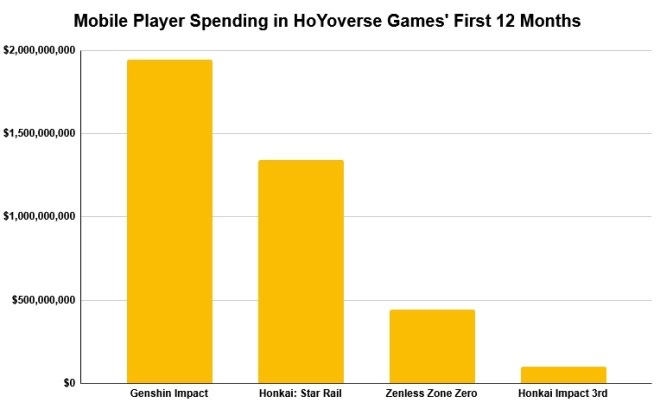
Zenless Zone Zero generated $442.1 million on mobile in its first year. That’s just 23% of Genshin Impact’s first-year mobile revenue, despite ZZZ having 45 million pre-registrations.
-
Clash Royale set a new post-pandemic daily revenue record: on July 8, the game earned $3.8 million – a record since December 20, 2021. The spike is linked to the new Merge Tactics mode.

-
Wittle Defender, a new title from Habby, hit $10 million in gross revenue. In its first month post-launch, the game earned $9.7 million (AppMagic data).
-
thatgamecompany announced that Sky: Children of the Light exceeded 270 million mobile downloads.
-
Com2Us reported 5 million installs of MLB Rivals over two years. According to AppMagic, the game generated $59 million for its creators during this period.
-
Valorant Mobile in China reached over 40 million pre-installs in 10 weeks.
-
Destiny: Rising collected 5 million pre-registrations worldwide. The launch is scheduled for August 28, 2025.
-
Sales charts for Nintendo Switch 2 briefly appeared on Nintendo’s website before being removed. As of the end of June, over 5 million Nintendo Switch units were sold. 1.8 million devices were bought in the US, 1.47 million in Japan, 1.18 million in Europe. The remaining sales were distributed among other countries. However, it should be noted that Nintendo stated these figures do not reflect reality.


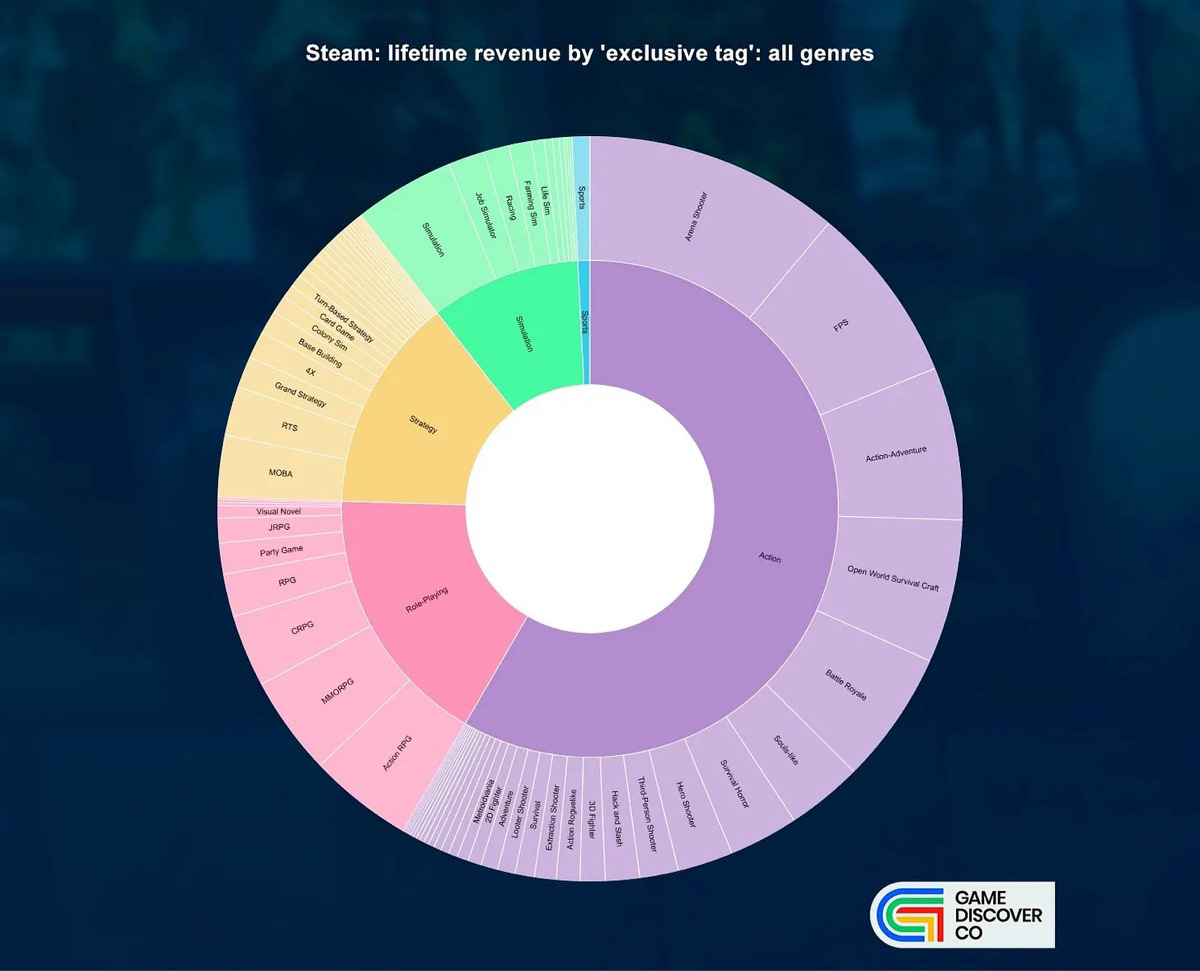
GameDiscoverCo considered only projects that generated more than $1M in gross revenue. The data covers the entire history of Steam.
The idea during the research was to assign each project a single genre and a single subgenre. Because of this, there may be debatable taxonomy questions (some of which I highlight below). This is a dangerous road, so pay respect to the bravery!
-
Action games (Arena Shooter, FPS, Action-Adventure, etc.) generated 58.37% of all Steam revenue.
-
RPGs are in second place (17.11%),
-
Strategy is third (13.97%),
-
Simulators fourth (9.76%),
-
and sports games come last.
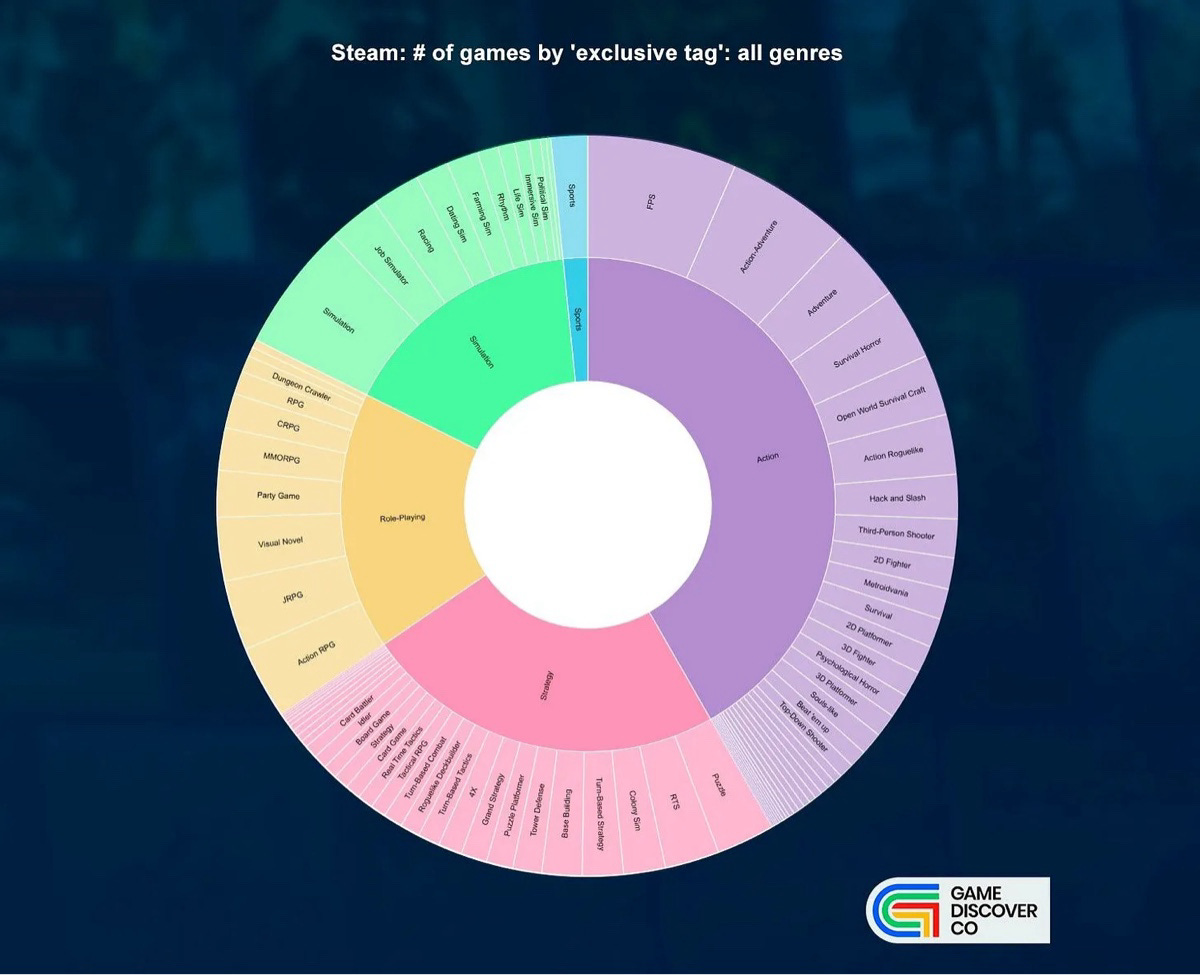
If you look at the distribution of released games by genre, you’ll notice that there are slightly fewer Action projects compared to their share of revenue. For other genres, there are more released games relative to the revenue they generated.
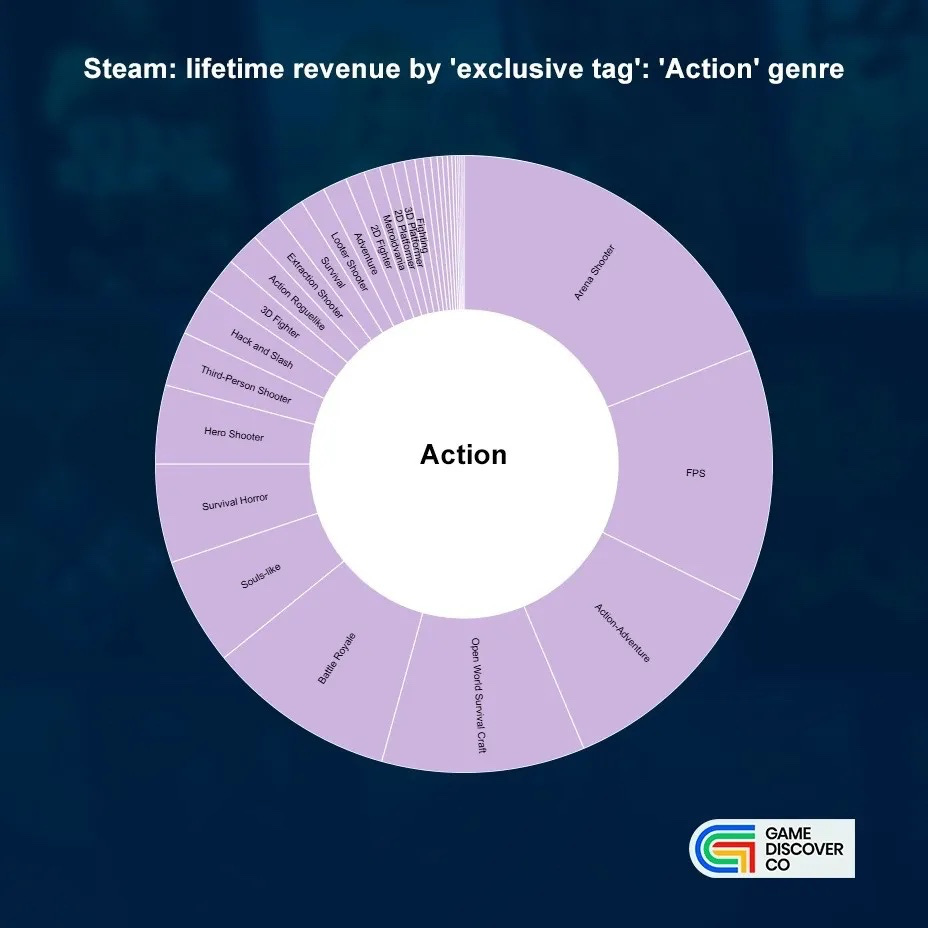
Action games generated 58,37% of all Steam revenue. Here is the breakdown:
-
Arena Shooter: 18.99% of action genre revenue, $9.52B — Counter-Strike 2 and others.
-
FPS: 13.3% — $6.67B (Call of Duty, Left 4 Dead 2, Ready or Not, etc.)
-
Action-Adventure: 11.37% — $5.7B (Red Dead Redemption 2, Hogwarts Legacy, Sea of Thieves)
-
Open World Survival Craft: 10.65% — $5.34B (Rust, ARK: Survival Evolved, Palworld, and others)
-
Other major subgenres: Battle Royale (9.89%), Souls-like (5.65%), Survival Horror (5.17%), Hero Shooter (4.12%), TPS (2.86%), Hack and Slash (2.55%).
Consider subscribing to the GameDev Reports Premium tier to support the newsletter. Get access to the list of curated articles & archive of Gaming Reports that I’ve been collecting since 2020.

RPGs make up 17.11% of all Steam revenue. Here’s the subgenre breakdown:
-
Action-RPGs earned more than other RPGs — 26.45% ($3.89B, e.g. Warframe, Monster Hunter World, Monster Hunter Wilds)
-
MMORPGs: 25.08% ($3.69B, The Elder Scrolls Online, Lost Ark)
-
CRPGs: 18.26% ($2.69B, Cyberpunk 2077, The Witcher 3: Wild Hunt, Fallout 4)
❗️In my view, all those projects are Action-RPGs.
-
RPG: 10.89% ($1.6B, Divinity: Original Sin 2 – Definitive Edition, Kingdom Come: Deliverance)
❗️Again, it feels that Divinity: Original Sin 2 better fit the CRPG, while Kingdom Come: Deliverance fits Action-RPG.
-
Other subgenres: Party games (7.89%), JRPG (6.2%), Visual Novels (3.18%), Party-Based RPG (0.76%), Dungeon Crawler (0.76%), Strategy RPG (0.3%).
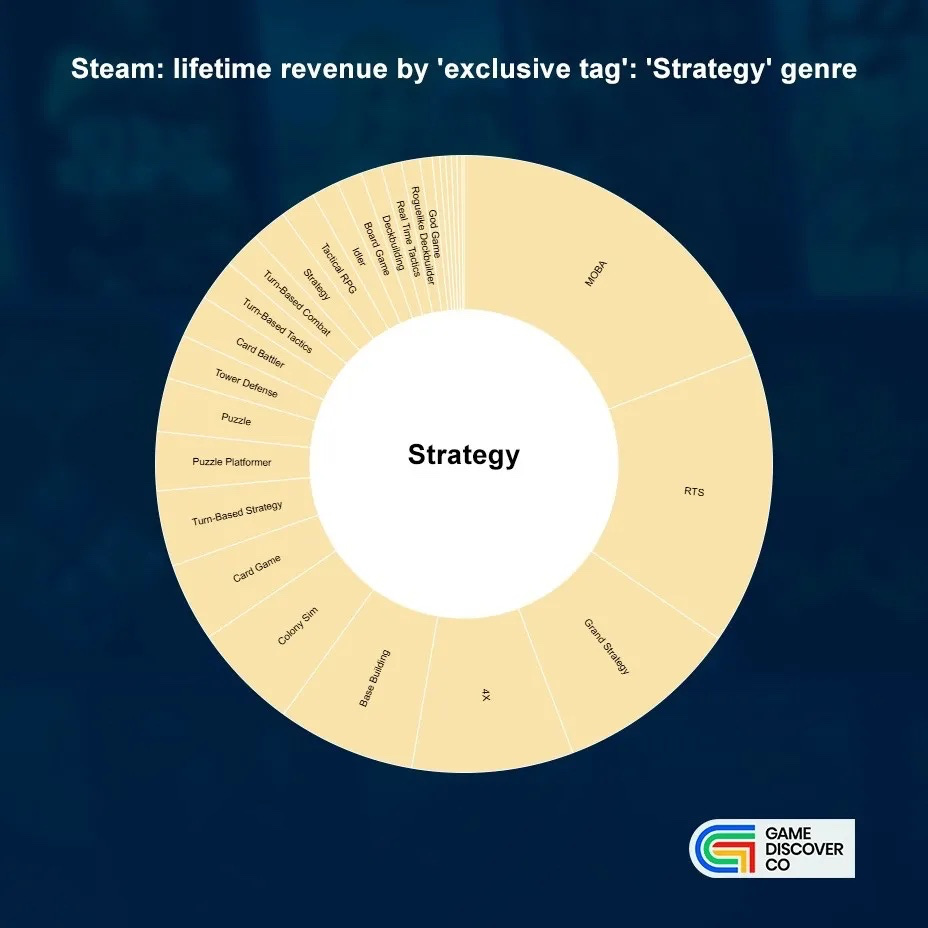
Strategy titles account for 13.97% of all Steam revenue.
-
MOBA: 19.23% of the genre ($2.31B, DOTA 2, SMITE, Eternal Return)
-
RTS: 15.33% ($1.84B, Total War: Warhammer II, Total War: Warhammer, Total War: Three Kingdoms)
-
Grand Strategy: 9.7% ($1.16B, Stellaris, Hearts of Iron IV, Europa Universalis IV)
-
4X: 8.45% ($1.01B, Sid Meier’s Civilization VI, Sid Meier’s Civilization V, Endless Legend)
-
Other top subgenres: Base Building (7.22%), Colony Sims (5.58%), Card Games (4.12%), Turn-Based Strategy (3.96%), Puzzle Platformer (3.09%), Puzzles (2.8%).
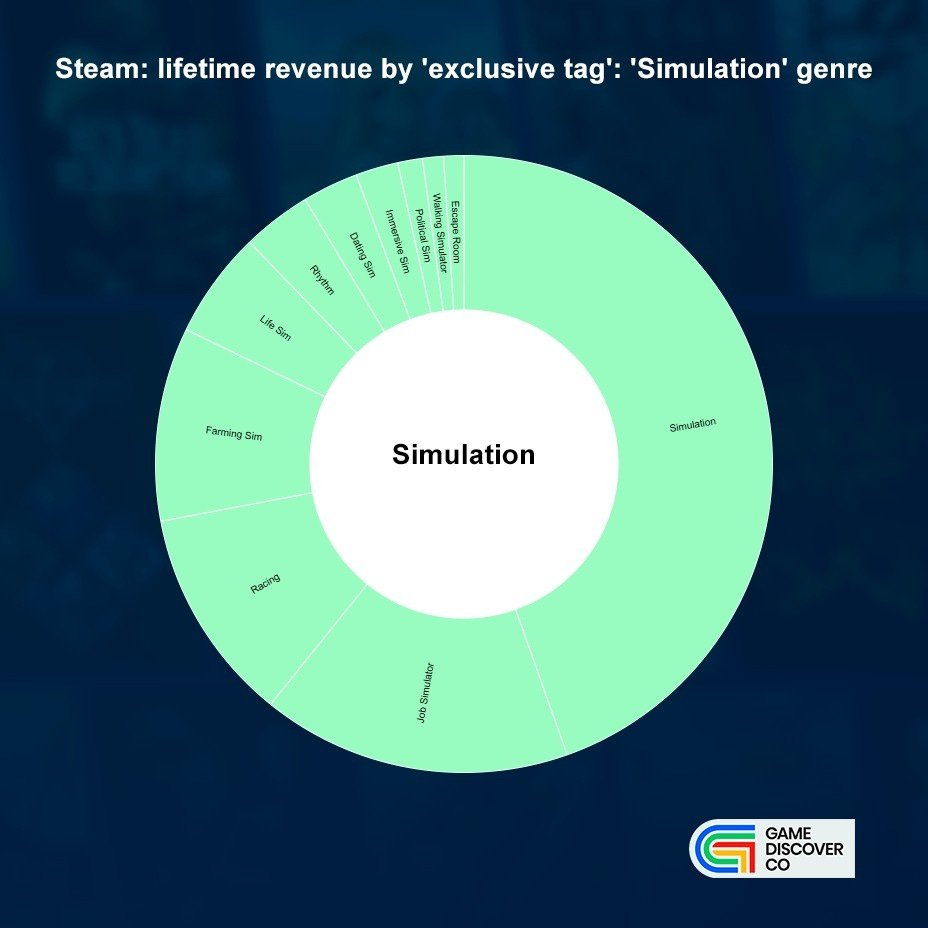
Simulators account for 9.76% of all Steam revenue:
-
Simulators: 44.57% ($3.74B, War Thunder, Arma 3, Cities: Skylines)
❗️As noted earlier, the methodology is discussable. Some projects should, in my view, be classed as Action games.
-
Job Simulators: 16.21% ($1.36B, Euro Truck Simulator 2, American Truck Simulator, Schedule I)
-
Racing: 11.24% ($942.9M, Forza Horizon 5, Assetto Corsa, Need for Speed Heat)
-
Farming Simulators: 10.15% ($851.3M, Stardew Valley, Farming Simulator 22)
-
Other subgenres: Life Sim (5.59%), Rhythm Games (3.63%), Dating Simulators (2.92%), Immersive Sim (2.23%), Political Simulators (1.3%), Walking Simulators (1.09%)
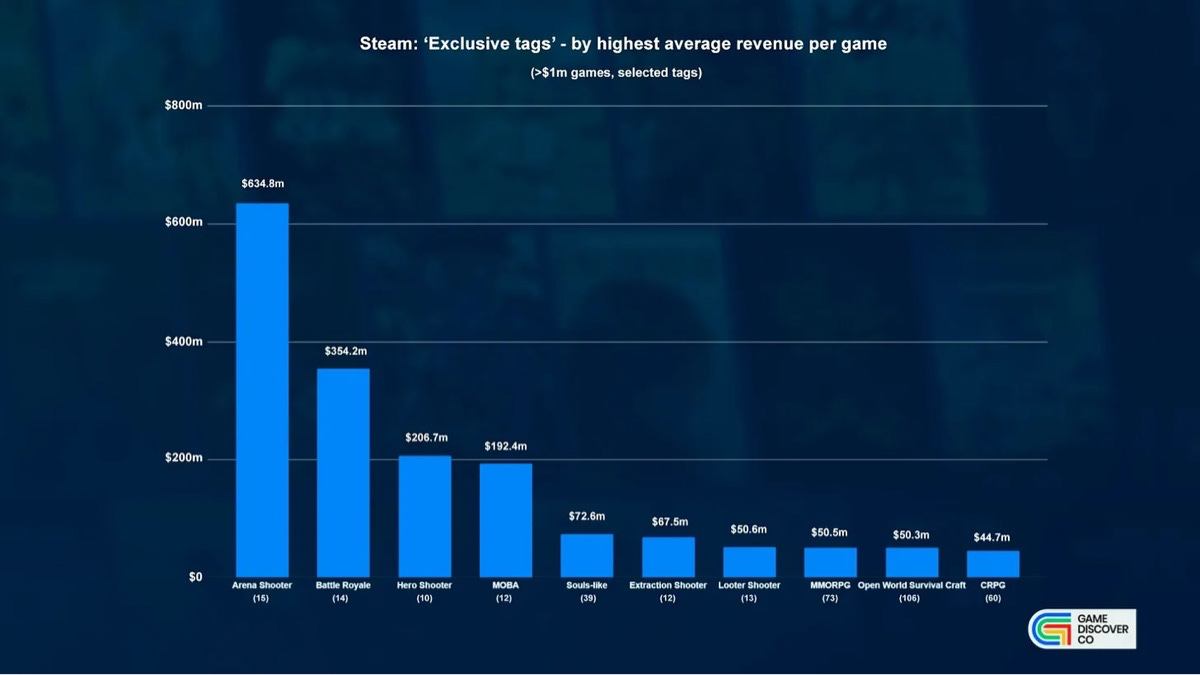
Among projects with more than $1M in revenue, Arena Shooter ($634.8M average) and Battle Royale ($354.2M) have the highest average revenue. In the entire history of Steam, only 29 games have broken the $1M mark in these genres. Since 2020, only Naraka Bladepoint, Overwatch 2, and Marvel Rivals have made over $25M in these subgenres.
-
Looking at things from the opposite side, subgenres with the lowest average earnings are: Action Roguelike ($8.4M — 104 games), Metroidvania ($7.9M — 53 projects), JRPG ($7.5M — 121 games).

-
In the Action Roguelike subgenre, 70 out of 104 projects were released after 2020.
GameDiscoverCo notes that by analyzing only projects that have earned more than $1M, thousands of games that did not reach this mark are excluded.